By Vasyl Postolovskyi and Olle Gladso
Contributing Writers and Instructors at Riverland Technical and Community College in Albert Lea, MN
In Part 1 of this Maximizing Tools series, we discussed an alternative approach to diagnosing an engine using the pressure waveforms from an in-cylinder pressure transducer. Part 2 continued our discussion in more detail, analyzing the Valve Timing and Ignition Timing tabs on the waveforms. In this final installment, we discuss the Inlet (or Intake) and Exhaust tabs.
To view Parts 1 and 2, visit http://bit.ly/StA6pi and http://bit.ly/XjQ8of.
The Inlet (or Intake) Tab
The Inlet (or Intake) tab displays a diagram of cylinder fill, depending on the engine speed and load. The height of the graph in Figure 1 represents the amount of gas remaining in the cylinder after the intake valve closed. The colors of the diagram traces reflect the engine load; the load value is being calculated by the vacuum in the cylinder during the intake stroke.
The red trace of the diagram allows us to estimate the influence of all the components of the intake system in filling the cylinder. The red trace is a measure of volumetric efficiency (VE). The higher the trace, the larger the maximum cylinder fill. In most circumstances, this directly relates to the cylinder’s efficiency. Some of the factors that affect the cylinder fill are: variable valve timing, lift, duration and overlap, the intake manifold design and geometry, the maximum cross section of the throttle body, the throttle angle, and the flow restriction of the air filter and the induction system.
The traces show the cylinder fill with low rpm or idle to the left and higher rpm to the right. The lower the trace is, the more efficient and economical the engine is operating. The height of the trace depends on variables such as: air/fuel mixture, ignition timing, EGR (exhaust gas recirculation), and any restriction from the exhaust system and power required from the engine. As the air/fuel ratio changes away from optimum, the trace will move higher. The more EGR is used, the higher the trace will be. The more exhaust restriction there is, the higher the trace will move.
As ignition timing changes, so will the trace. And finally, as demand on the engine changes, so will the height of the trace. Power demand can vary due to a number of reasons, even at idle; head lights on/off, air conditioning on/off and so on.
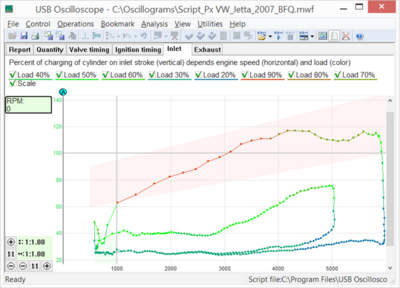
Next we will compare the inlet or intake diagram from two engines. These two engines have significant differences in their induction system design. Neither of the engines use turbo or super charging. Figure 2 is an engine equipped with a carburetor and one intake and one exhaust valve. No variable valve timing is utilized on this engine. The intake manifold design has to accomodate fuel as well as air.
It can clearly be seen that this engine does not have increased cylinder fill with increased rpm. Also, the trace is only within what is considered the normal band in the 1,200-4,600 rpm range, outside that rpm band the cylinder fill is below. Based on this, it is clear that this is an engine designed to operate in a low rpm range.
It should be noted that with the increase in rpm, the color of the diagram gradually goes from warm to cold. This is especially pronounced after 4,500 rpm. This is because the induction system represents a restriction in this rpm range and the cylinder fill is decreasing.
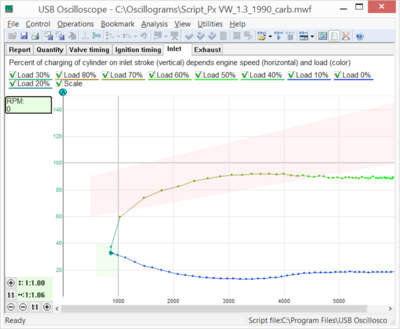
Figure 3 is from an engine with a different design. This engine is equipped with variable valve timing and is using four valves per cylinder: two intake and two exhaust valves. The induction system is designed very differently, the engine uses port fuel injection and the intake manifold is designed for air only.
The red trace in Figure 3 clearly shows that this engine has much better cylinder fill throughout the rpm range compared to the engine in Figure 2. This engine is designed to operate well at higher rpm. Even though the engine is designed for higher rpm, the cylinder fill at low rpm is comparable to the diagram from the low rpm engine.
The color of the diagram is hotter than in the previous example, and starts to change toward warm only after 5,500 rpm. This means that the induction system is causing little or no resistance to air flow into the cylinder.
Also noticeable is that the cylinder filling of this engine at rpm higher than 4,000 significantly exceeds 100%. This is achieved without forced air injection. The overunity cylinder fill is achieved through the use of variable valve timing and a tuned induction system. The intake valve is left open for some degrees of crankshaft rotation after BDC on the intake stroke. The velocity of the incoming air is high and will continue to fill the cylinder even after the piston has passed BDC, thus creating a slight over pressure in the cylinder.
The Exhaust Tab
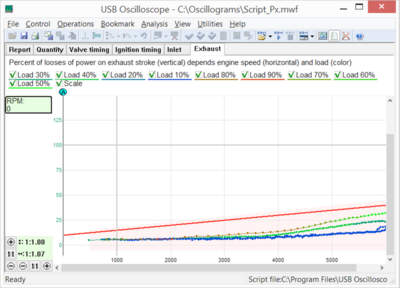
The Exhaust tab displays a diagram showing the amount of work spent on expelling the exhaust gases from the engine. Figure 4 shows a diagram taken from an engine with normal exhaust system restriction.
The lower the trace, the less exhaust restriction exists. The sloping red line signifies the allowable exhaust restriction. This trace was determined empiricially by collecting data from several engines, some in good working order, some not.
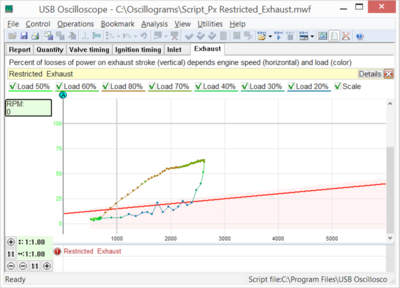
Figure 5 shows what the trace will look like with a severe exhaust restriction. In this case, it is a plugged catalytic converter. The exhaust restriction could also be caused by insufficient exhaust valve lift or other issues.
The diagrams in this tab are calculated based on the effect the exhaust system back pressure has on the piston movement. If the peak back pressure occurs when the piston is close to TDC, the effect of the back pressure is minimal. This is because the piston speed is minimal at that moment.
On the other hand, if the peak back pressure occurs when the piston is approximately midway through the stroke, the effect is much more pronounced. For this reason, the actual exhaust system design does not have as much of an effect on the trace as does unintended restrictions. Because of the dynamic manner in which the restriction is measured and calculated, smaller restrictions can be detected before they significantly affect the engine performance.
Procedure for Recording the Waveforms
When recording the cylinder pressure graphs, it is desirable to follow a sequence that will allow the maximum amount of information to be obtained in the shortest amount of time.
It is recommended to start recording when the engine is idling. After 3-5 seconds, slowly increase the speed, then allow the engine to fall back to idle. After the idle speed has stabilized again, quickly perform a snap throttle to wide open throttle. As soon as maximum rpm is reached, turn off the ignition while leaving the throttle open. Doing this will cause additional information to be captured for the Inlet and Exhaust tabs.
More details and updates can be found at www.injectorservice.com.ua.