Our repair shop mainly sees low-end cars with the most popular brands being Chevrolet, Renault and KIA. Occasionally we may see some Toyotas. Every once in a blue moon we may see a Subaru or Isuzu. So, in a shop like ours, you need to know how to diagnose and repair all of them. Fundamentally, most all vehicles operate in the same manner and with similar features. At the same time, however, there are some interesting differences. The vehicle we will spend some time with today is a 2007 Subaru Legacy, a fairly old vehicle as these things go.
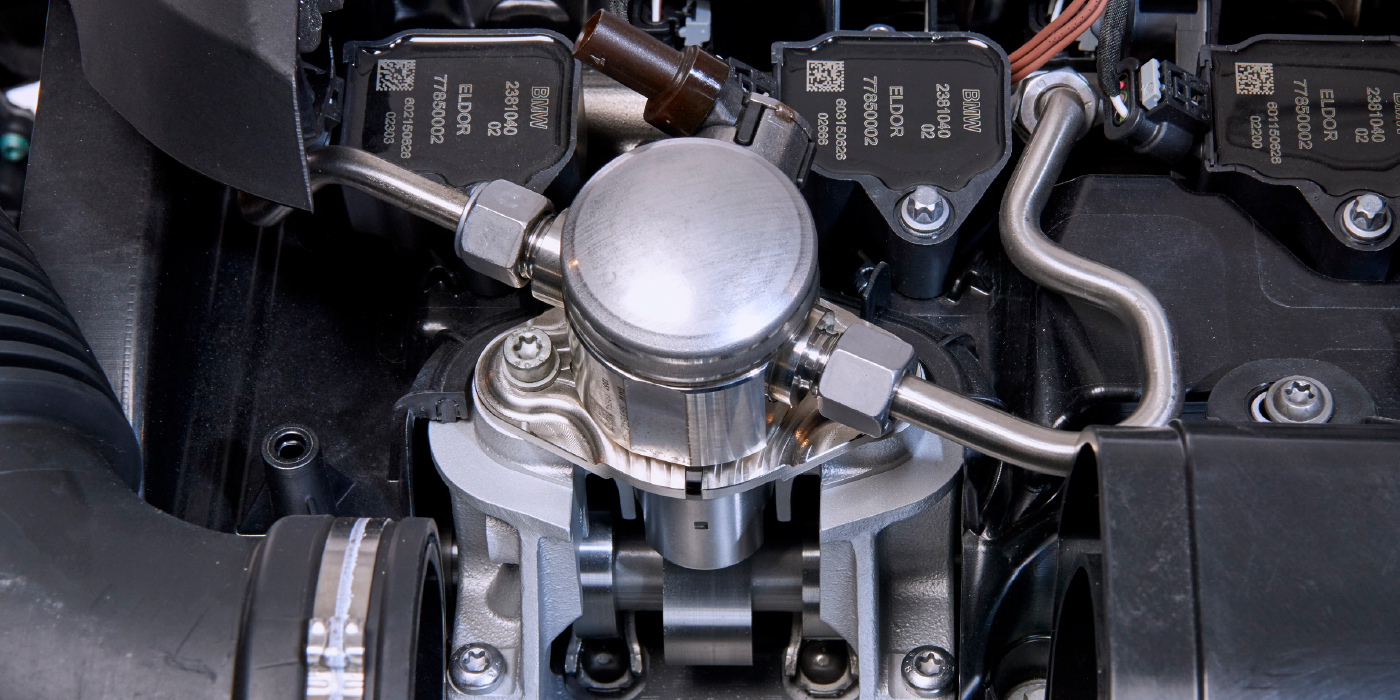
The vehicle is equipped with the 2.5L EJ25 engine. A key feature of this engine is that it is of a horizontally opposite design; the cylinder block is located horizontally, and the axis of the cylinder pairs are opposing each other. This design is known as a boxer engine, because the pistons face opposite each other much like boxer fists.
The rest of the engine design is relatively conventional with port fuel injection, a dual ignition coil for the four cylinders, no variable valve timing mechanism. There is a system for variable intake valve lift, however. Being a boxer four cylinder, the firing order is an unusual 1, 3, 2, 4.
The owner complains about an engine vibration. The initial impression is that the engine simply has an inoperative cylinder. The problem appears to be a classic misfire issue. Shouldn’t be too difficult to diagnose, right? Basically, only three things need to be checked/ruled out.
- compression in the cylinders
- fuel delivery to each cylinder
- ignition system.
Normally, before a diagnosis procedure is started — or actually, this should be considered the start of the procedure — the customer is interviewed regarding the problem experienced.
We asked how, when, and under what circumstances the problem occurred. It turns out the problem started about six months ago. The engine was overhauled and the crankshaft, connecting rods, bearings and pistons were replaced. Since the problem started at that time, it is reasonable to believe that the problem is related to the repair. Perhaps a mistake was made.
An obvious question of course is why the vehicle wasn’t brought back to the original repairer. The customer did not have a good answer to that question, so we “let that dog lie.” There could be a number of reasons.
The problem is a mistake, or if you will, “an installed problem” can be very difficult to analyze and diagnose because the issue may not follow any logical pattern. It is after all, a random mistake. Almost as difficult to diagnose as some intermittent problems can be.
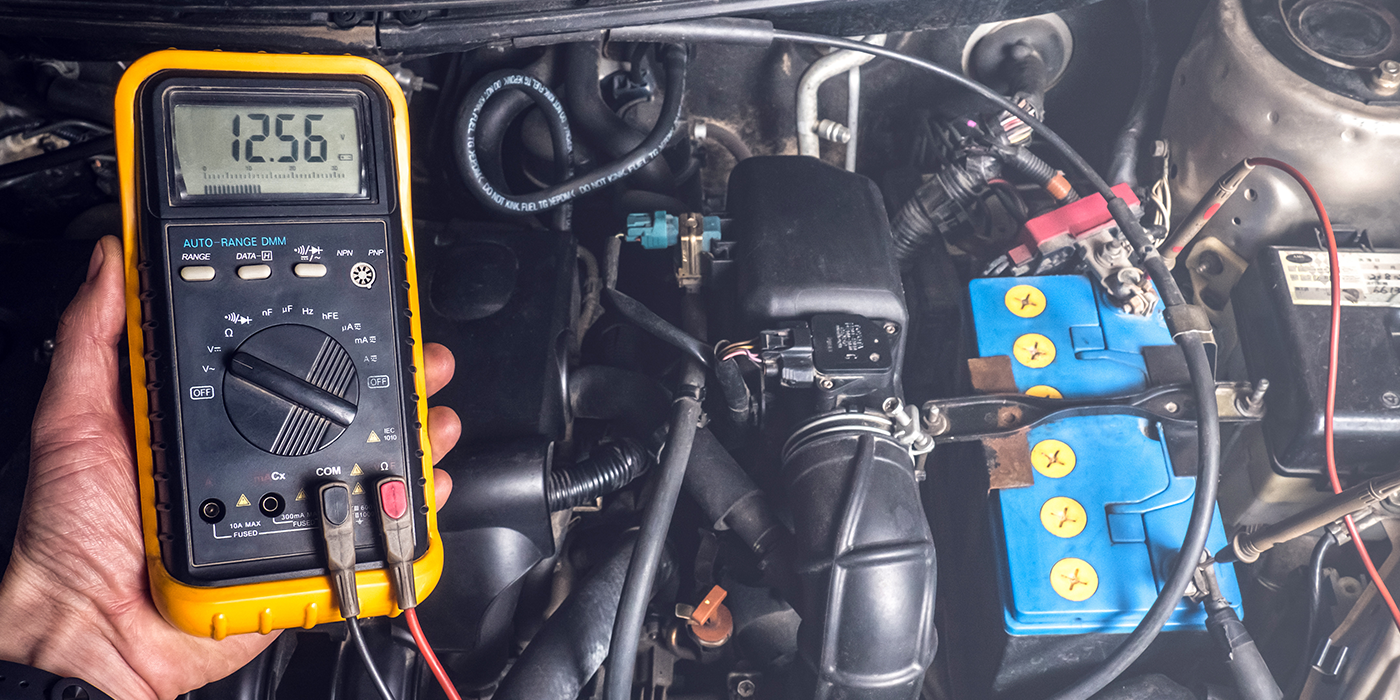
A scan tool is connected to read codes and data. Perhaps the problem can be easily found by looking at the scan data. Unfortunately, none of the scanner data give rise to any major suspicions. One of the most important parameters to a diagnostic technician is the fuel correction factors or trims. In this case, they are very close to nominal. The long-term fuel trims are skewed by about 6%. As a general rule of thumb, up to a 5% deviation is considered acceptable. So, a little on the high side. But, the car is 10 years old with quite a bit of wear and tear, so a concern, but not a major one.
The ignition timing control system is also performing as it should. The only DTC is related to a loss of communication with the automatic transmission controller. Could there be a connection between a loss of communication and the engine misfire? Probably not.
A good logical next step would be to perform a cylinder power balance test to find which cylinders are under-performing. Using the USB Autoscope and the associated software we can determine not only which cylinder but also the reason for the performance problem. Is it due to a fuel supply problem, an ignition system problem or a mechanical problem?
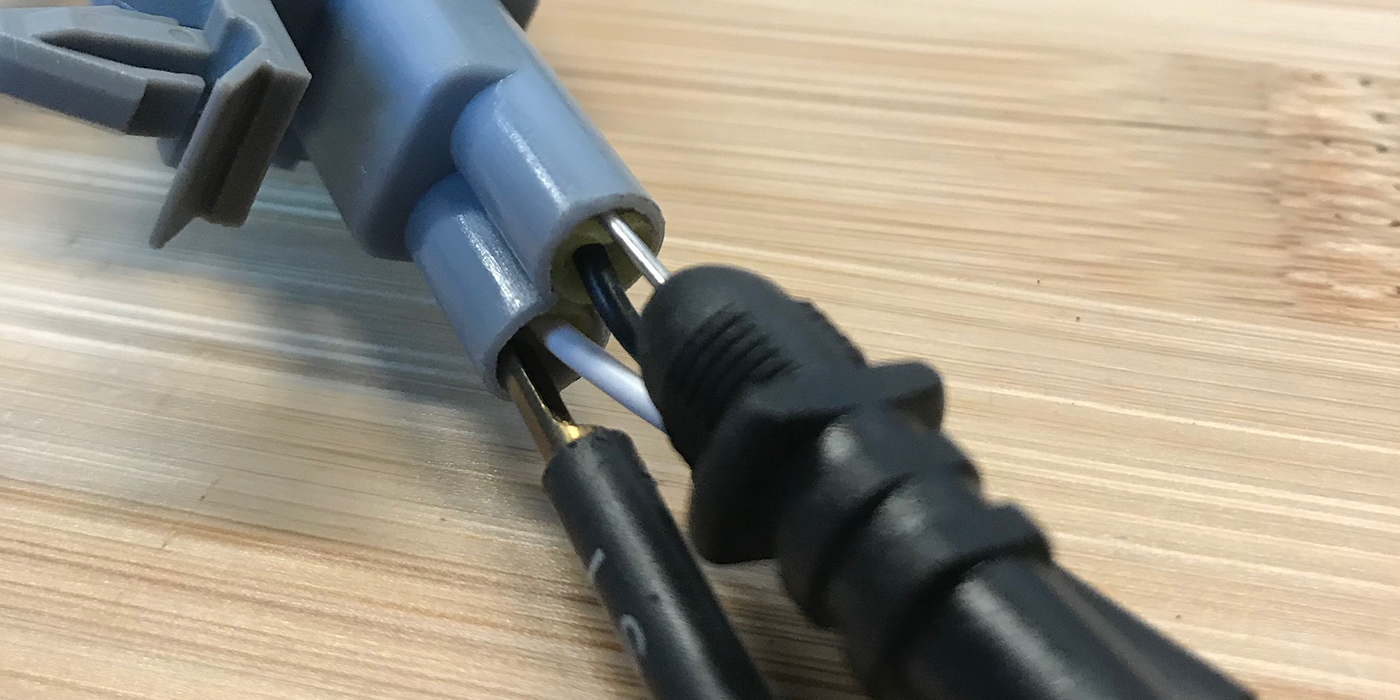
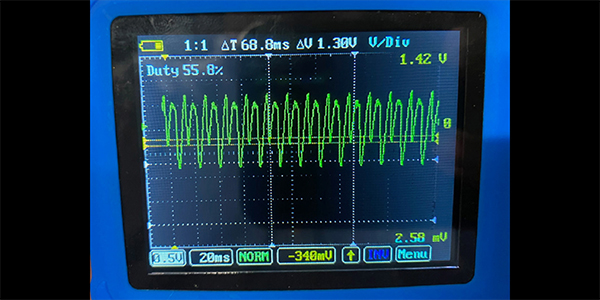
To perform the test, one of the engine analyzer channels must be connected to the crankshaft position sensor, and another channel to a plug or coil wire for synchronization. After each ignition and combustion event, the crankshaft angular velocity increases. The amount of speed increase depends on how efficient the cylinder is. The USB Autoscope software processes the signal from the crankshaft sensor, ties the result to engine cylinders based on the synchronization signal from the plug or coil wire and calculates the operating efficiency of each cylinder based on the acceleration value of the crankshaft and builds a graph for each cylinder.
It should be noted that the efficiency graph is not an absolute measurement of torque or power. Rather, it is a comparative measurement where we compare the different cylinders to each other. That is the important question to answer; how do the cylinders compare?
When reviewing efficiency graphs, certain things will stand out, making diagnosis relatively straightforward in most situations. For example, if the efficiency graph of any given cylinder falls below zero during a snap throttle condition, by far, the most likely problem is ignition related. (The ignition system cannot keep up with a sharp increase in voltage demand during snap throttle conditions.) A uniform decrease in efficiency for one particular cylinder over the entire operating range is most likely a problem with fuel delivery to that cylinder. If the end of the graph goes down, it is most likely a compression or cylinder leakage problem. The test algorithm is designed so that the end section of the graph reflects the pressure in the cylinder.
So, we take the USB Autoscope, connect it, perform the cylinder power balance test and let the software generate the cylinder efficiency graphs (Figure 1).
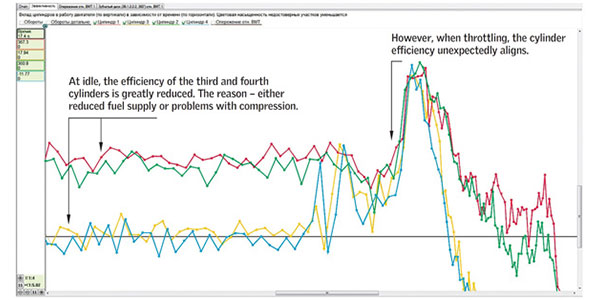
Unfortunately, there are a number of ambiguities on the graphs.
Uncertainty No. 1: During idle operation, two cylinders fell out of operation: the third and fourth. Given the numbering of the Subaru cylinders, this is a pair of cylinders that are opposite each other. If they just fell out, the diagnosis would be fairly straightforward. Unfortunately they behave in a very stable manner, almost as if the behavior is intended to work stably, but on every other combustion event.
Uncertainty No. 2: During snap throttle, the cylinder efficiencies suddenly align and become very similar. The problem present at idle suddenly appears to go away.
Uncertainty No. 3: The end of the graph, the tail. Here there is no combustion, so we are measuring cylinder pressure or density specifically. As Figure 2 shows, the third and fourth cylinders, which do not work at idle, have significantly higher cylinder pressure or compression than the first and second cylinders.
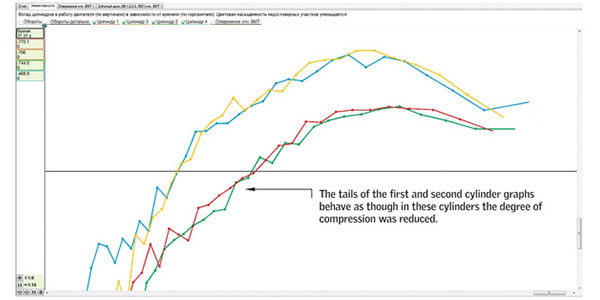
The real strange thing is that the graphs do not show a loss of compression like you would see with cylinder leakage, but rather a lowered compression ratio. Almost like someone installed shorter connecting rods in cylinders No. 1 and 2!
The results just do not make sense. Are there bugs in the engine analyzer software giving us nonsense results? The engine runs very badly, so the analyzer cannot be that far off the mark. On the other hand, the graph results are just not possible.
Thinking further about the problem, since the cylinder efficiency test showed that the compression ratio was reduced in two cylinders, why not perform a cylinder pressure test? Since our engine analyzer has the ability to automatically process the resulting pressure waveforms and output the result in text form, let’s try! The result is shown in Figure 3.
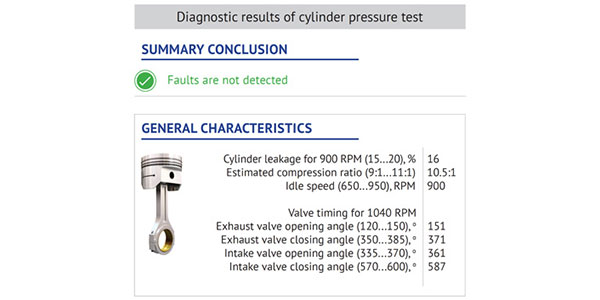
The in-cylinder pressure tests did, in fact, achieve a result. The test increased our confusion significantly. It turned out that the estimated compression ratio, according to the software calculations, is almost the same in all the cylinders.The loss of gases during compression was about 16%, which is also quite a decent result. The resistance to flow in the exhaust system is slightly increased, but, being so slight, cannot be the cause of the badly running engine.
Not believing the automatic analysis, we manually analyze in-cylinder pressure waveforms. We do not see anything out of the ordinary at all. The pressure at piston top dead center in each cylinder is about 6 bar or 87 psi. The cylinder waveforms are essentially mirror images of each other.
Time to take a break, get some coffee and put on the thinking cap. Basically thinking out loud here…
Firstly, according to the results of the in-cylinder pressure test, all the cylinders are mechanically sound. Our in-cylinder pressure sensor cannot behave differently in different cylinders, right?
Secondly, the efficiency graphs of the cylinders show completely unpredictable behavior. This means that the engine behaves unpredictably. It really does run very rough at idle, so the graphs do give an honest representation of the engine’s behavior. In all likelihood the problem is either in the engine or the ECU.
Thirdly, experience shows that an ECU failure is unlikely in most cases, unless the ECU is full of water or coolant. However, the engine was recently overhauled. Could something have been assembled incorrectly? Sure. Could something have been damaged during assembly? For sure. Just think about how many ground wires weren’t properly attached to engines that subsequently would not start or ran very badly. How many pinched and melted wiring harnesses have been replaced or repaired after major engine work? How many bent reluctor wheels and flexplates were replaced!
Boom! That is worth checking! The reluctor wheel that is. The efficiency test, which we performed at the very beginning, not only builds efficiency graphs, but also measures the parameters of the reluctor wheel at the same time. Figure 4 shows the result from the reluctor wheel test.
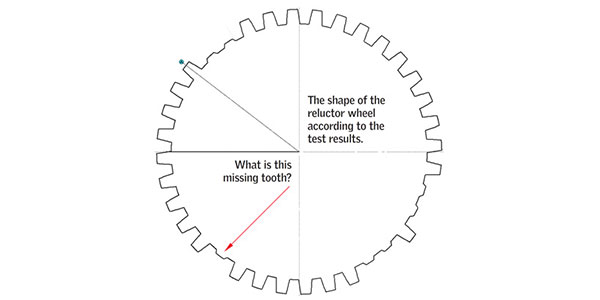
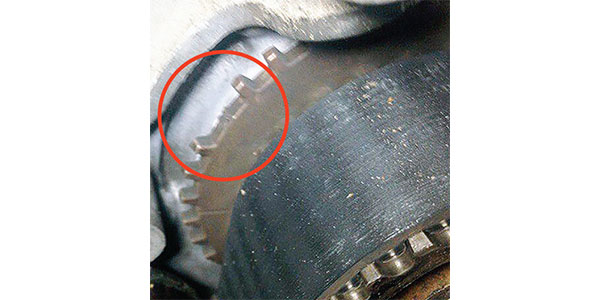
Subaru engines traditionally use a 36-2-2-2 disc. 36-2-2-2 means that the teeth on the wheel are spaced for 36 teeth. However, the design has three pairs (2-2-2) of them missing. That is clearly shown in the graph in Figure 4. However, the graph also shows one more missing tooth. The visual confirmation, as shown in Figure 5, clearly shows a broken tooth on the reluctor wheel.
So, the problem was directly caused by the engine overhaul being improperly done. Somebody probably tried to stop the engine from turning using a screwdriver or pry bar on the reluctor wheel. Maybe while aligning the timing belt. Who knows? In any case, don’t do it. Way too many reluctor wheels (and flexplates for that matter) have been bent or otherwise damaged doing that. Find a better way.
So, we ordered a new reluctor wheel. It only took two weeks for the new wheel to arrive, but once we installed it, the engine started and ran perfectly.
A question to ponder is: Why did the missing tooth cause the engine to operate so weirdly? We can only guess. There is very little information available about the internal software logic of the ECU operation. There is some incomplete and sometimes unreliable information obtained by chip-tuning enthusiasts. The mathematical modeling of the engine necessary for the ECU software to operate correctly and efficiently is considered proprietary by the vehicle manufacturers and the information is unavailable.
We can assume with certainty, that due to the broken tooth, an error crept into the algorithm used to determine the rotational speed and position of the crankshaft. This error most likely affected other parts of the software operating within the ECU as well. More than likely, this type of an error was not anticipated by the manufacturer. Why not? Because a situation like this is unexpected. Not only the missing tooth, but which missing tooth and how many would have to be accounted for. The software is not adapted for a situation like that, so how it will react is difficult to predict. In our case, the reaction resulted in a very rough running engine at idle. Oddly enough, when the engine RPM was increased, everything fell into place.
One more thing to ponder: Why did the cylinder efficiency test show different compression ratios? That question is also difficult to answer. We do know that for the USB Autoscope software to correctly process and interpret test results it adapts to the characteristics of the reluctor wheel. For the adaption to occur, the engine has to slow down evenly. To ensure uniform deceleration during the test, the technician opens the throttle, raises the speed and then abruptly shuts off the engine. During this time the reluctor wheel adaptation is performed.
Apparently, the conditions of uniform deceleration of the crankshaft necessary for the test to perform calculations were not met. Mainly due to incorrect operation of the electronic control unit. As a result, we saw test results with different compression ratios where there actually was none.
Maybe our reasoning is correct, maybe not. That is really not the point, the vehicle is repaired and the owner is happy. That should be the end result of an automotive technician’s work.