By Andrew Shulgin, Vasyl Postolovskyi and Olle Gladso
Contributing Writers and Instructors at Riverland Technical and Community College in Albert Lea, MN

Will there be a day when computers replace the automotive technician as it comes to diagnosis and fault finding – when computers accurately locate faults in the electronics and mechanics of vehicles? Computers already greatly facilitate the process of diagnostics and troubleshooting. For example, the PCM can detect a variety of faults and store data such as the operating conditions when the problem occurred as well as diagnostic trouble codes. Hand-held scan tools, whether stand-alone or existing as software running on a computer, read and interpret the data to provide step-by-step instructions for finding and repairing these faults.
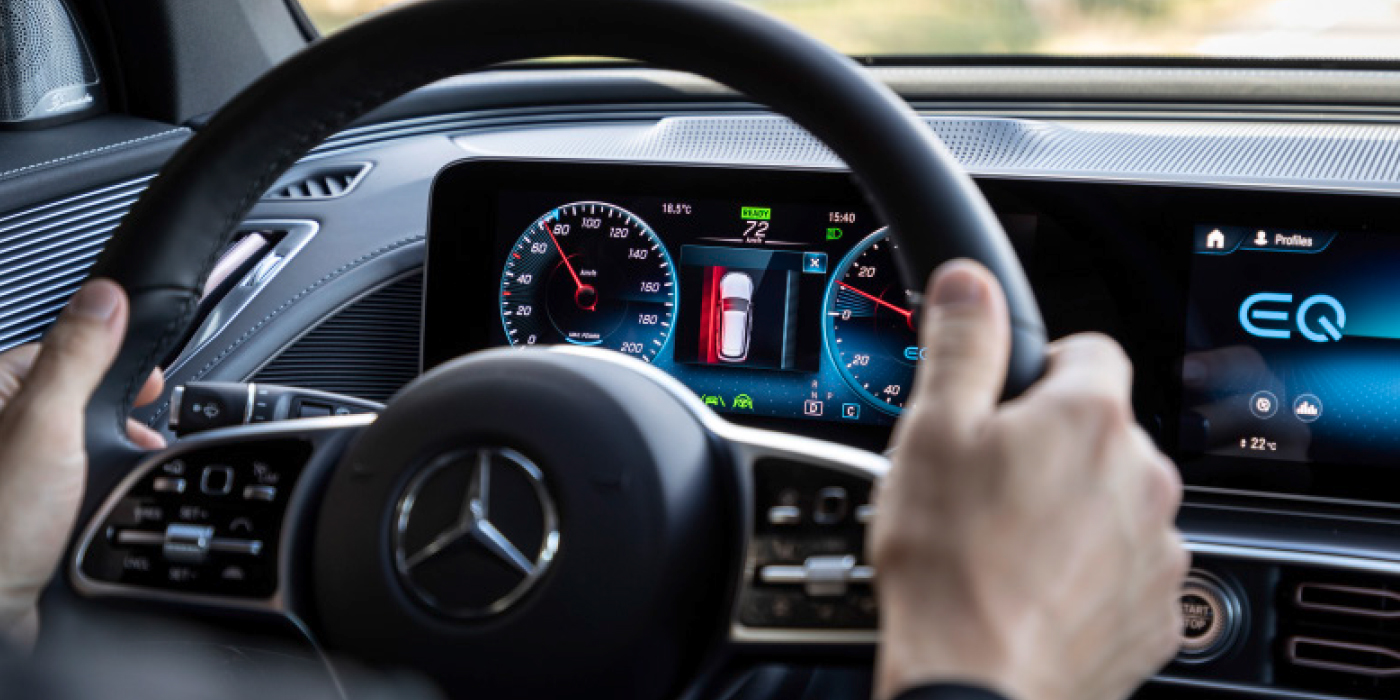
For various reasons, modern cars are becoming more technologically advanced. The number of electronic units, sensors and actuators are steadily increasing. The electronic control modules receive a huge amount of data from sensors. Using complex algorithms, the control modules use actuators in some form to control the operation of the entire powertrain, including engine, transmission, steering, suspension and brakes.
However, control modules may not recognize all faults, as it is difficult or impossible to predict all possible combinations of component and software errors.
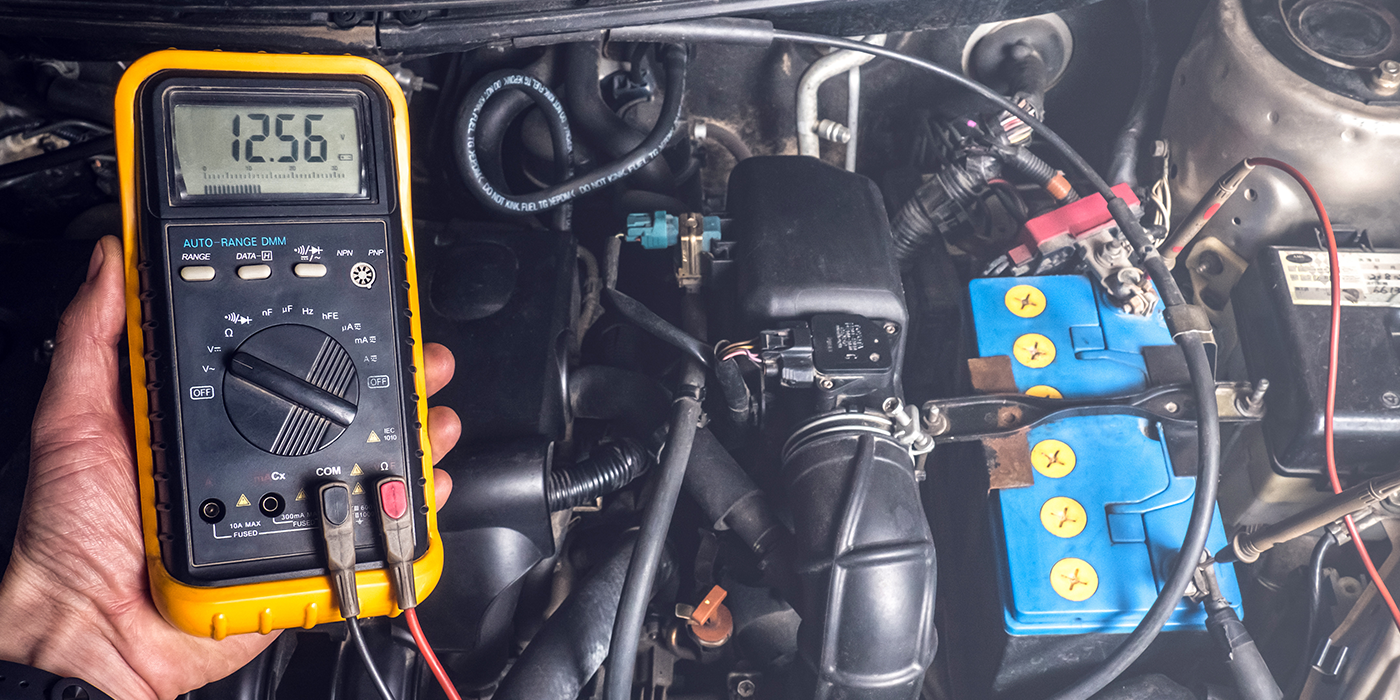
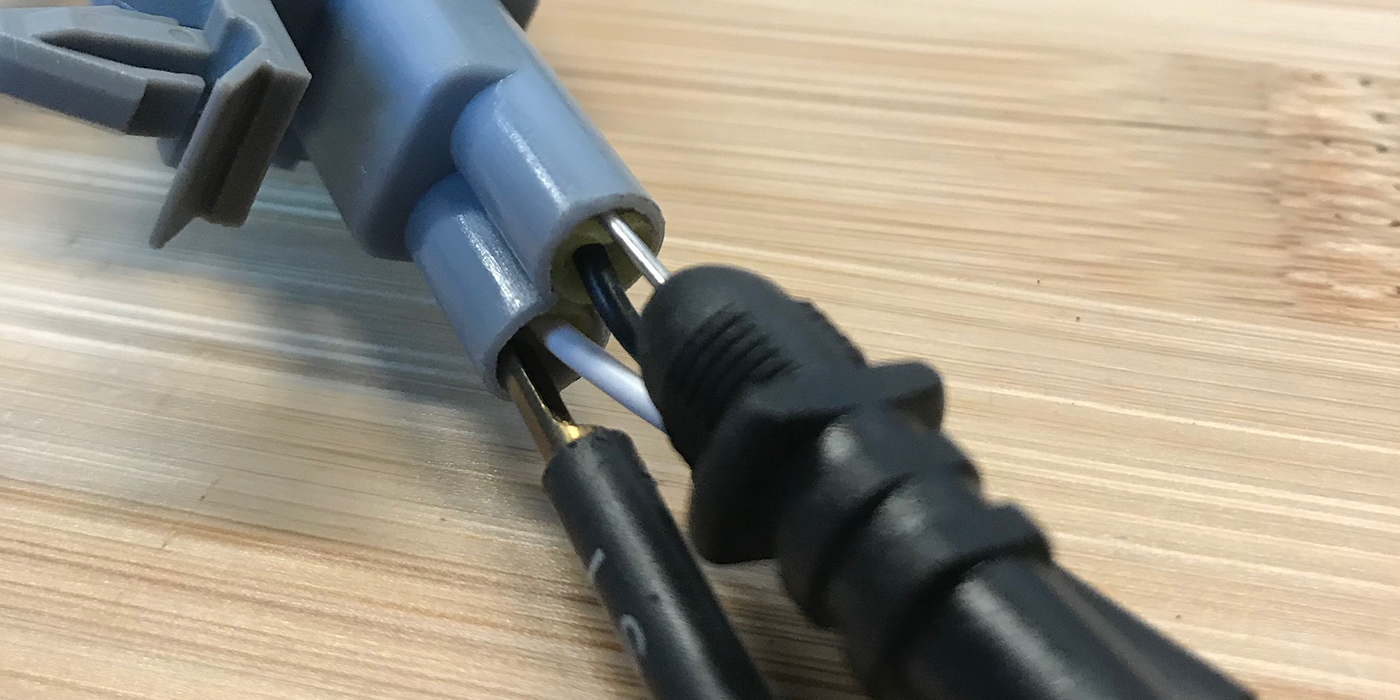
DTCs may be stored due to combinations of mechanical, electronic or software faults unrelated to the actual code description. In order to accurately and correctly diagnose problems, it may be necessary to rely on data from a DMM (digital multimeter) or an oscilloscope. Being able to see and analyze actual circuit and component waveforms can be a great help in understanding how a circuit or component works (or doesn’t work). This allows you to better understand the processes and identify faulty components.
It can be especially difficult to find a fault that only appears for a short time and does not set a DTC. It is often helpful having specifically designed oscilloscopes available when attempting to find intermittent or no-code problems. Even with these types of tools at your disposal, you may still find yourself spending a lot of time recording and analyzing various signals, especially when searching for those parts of the waveform where the malfunction of the sensors or mechanisms exist.
Sometimes, recording a single waveform and attempting to analyze it may be futile. It may be necessary to record multiple waveforms simultaneously. Manually analyzing multiple waveforms, especially if trying to discern more or less obvious relationships between the waveforms, may be very time consuming and error prone. This is particularly true if analyzing a large amount of data.
In these cases, some form of automated signal analysis can be very beneficial. Time and money saved, and fewer errors to boot. It is especially difficult to analyze a repetitive or periodic signal in which a single failure point exists, but where the failure does cause engine performance concerns. Here we are going to give some examples where an automated script in combination with the software and hardware that makes up a modern oscilloscope, in this case the USB Autoscope IV, performs analysis for us.
The script used here is written by Andrew Shulgin at Injectorservice and is called the CKP script. The script analyzes the signal from the crankshaft position sensor and provides results that help to identify in what cylinders misfires occur, as well as their cause. Malfunction could be engine mechanical, fuel system or ignition system. The CKP script analyzes engine conditions, such as rotational symmetry, under all operating conditions, whereas common scanners may only provide data during idle conditions. Engine mechanical and electronic malfunctions may only be manifest during heavy load or high rpm.
The CKP script has several tabs that perform different functions. In this article, we will look closer at one particular tab, called “Phase.”
In order to understand what this tab displays, imagine a piece of paper rolled into a tube, rotating along with the engine’s camshaft. As the tube is rotated, pens mounted above the paper tube make marks on the paper. As the camshaft rotates, the tube gradually shifts sideways, causing the pens to draw a line on the sheet in a spiral or helical form. The color of the ink used changes as the signal level changes. When done, the paper tube is flattened back out into a sheet and we have the “Phase” tab.
The “Phase” tab therefore shows the investigated waveform as a gradient that changes color from light to dark depending on the signal level. A low signal level is represented by a light color and a high signal level is represented by a dark color. The horizontal or sideways scale represents time from left to right. The vertical scale from top to bottom represents the angle of crankshaft rotation. Thus, one complete engine cycle or two crankshaft revolutions (720°) is represented by one vertical line. The next line is placed to the right of the first line corresponding to the next cycle of the engine, and so on. These vertical lines, light or dark in color, fill the whole tab.
These light and dark lines form gradients or areas representing the duration and nature of the signal changes depending on the angle of camshaft rotation.
The “Phase” tab can display the signal from any sensor or actuator, referenced to camshaft rotation. If only one pulse occurs for one complete engine cycle, then the “Phase” tab will only display one single horizontal line. If this single pulse begins and ends at the same angles of camshaft rotation, then the position of the horizontal strip will not move up or down – it will be a straight horizontal line.
Examples:
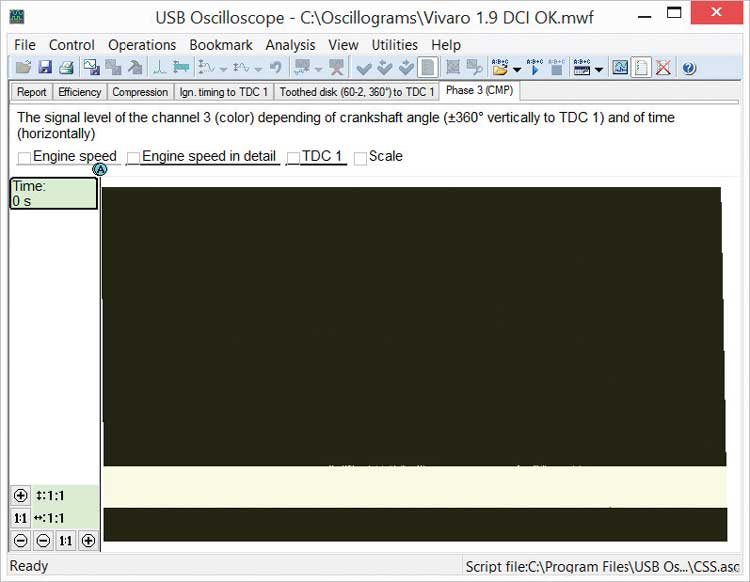
Figure 1 shows an example of normal operating conditions. This example displays using the “Phase” tab the signal from the camshaft position sensor of an Opel Vivaro equipped with a 1.9L GDI (Gasoline Direct Injection) engine.
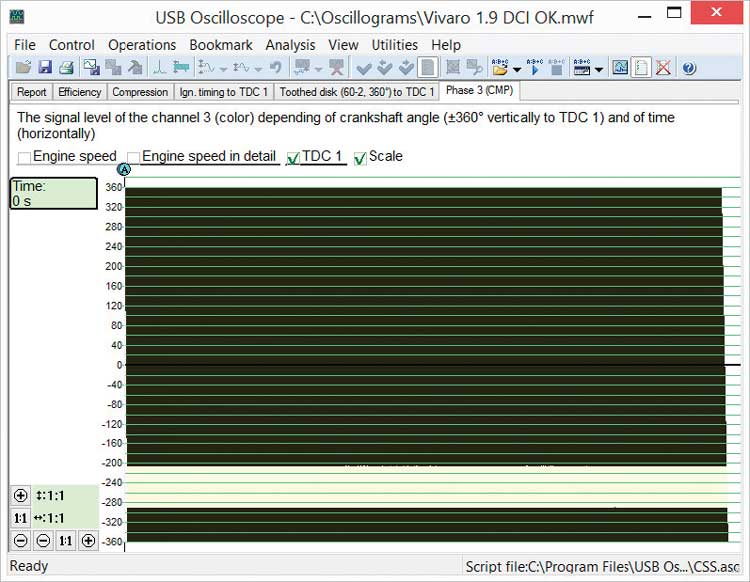
Figure 2 shows how analyzing is much easier and clearer if we enable a grid of crankshaft rotation angle and graph showing the engine rotations.
In Figure 2, it is evident that the camshaft sensor generates a low level stable signal between 205° to 290° of crankshaft rotation angle, relatively to a reference point of TDC of the first cylinder. In the beginning, the engine was running at idle speed, followed by 2,700 rpm and 4,200 rpm.
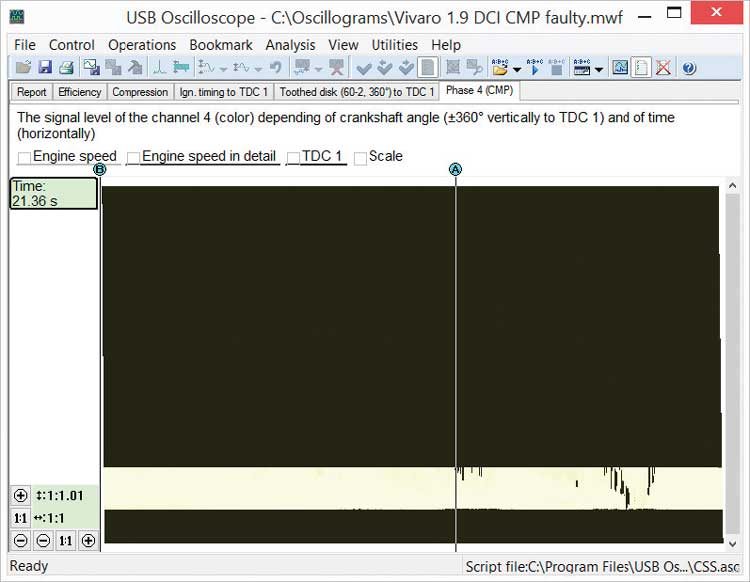
Figure 3 was obtained from a similar car, where the MIL intermittently illuminates due to a camshaft sensor error. On the light strip that corresponds to the low level signal from the sensor, you can see intermittent distortions.
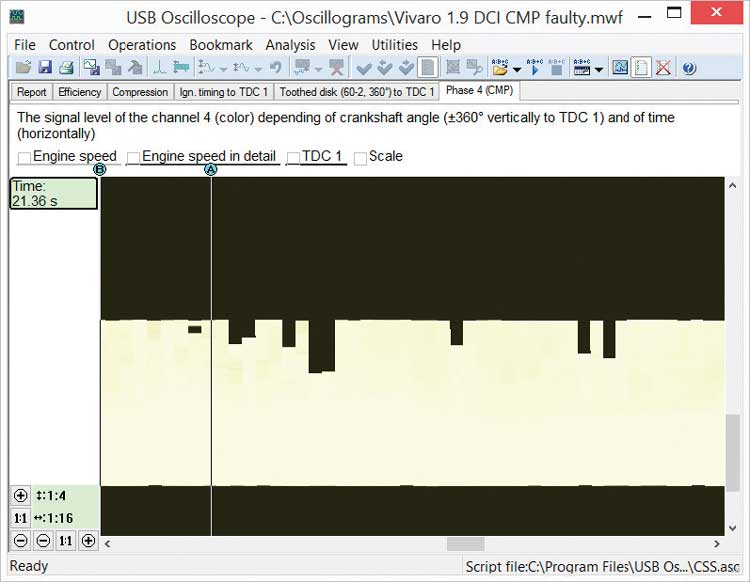
Figure 4 shows these distortions zoomed in or enlarged. This figure also shows that by moving the “A” marker you can measure the time from the start of recording until the problem appears. In this particular example, the problem occurs at 21.36 seconds. Knowing the point in time at which the problem occurred, you can quickly find and detail analyze the corresponding time frame in the original waveform as shown in Figure 5.
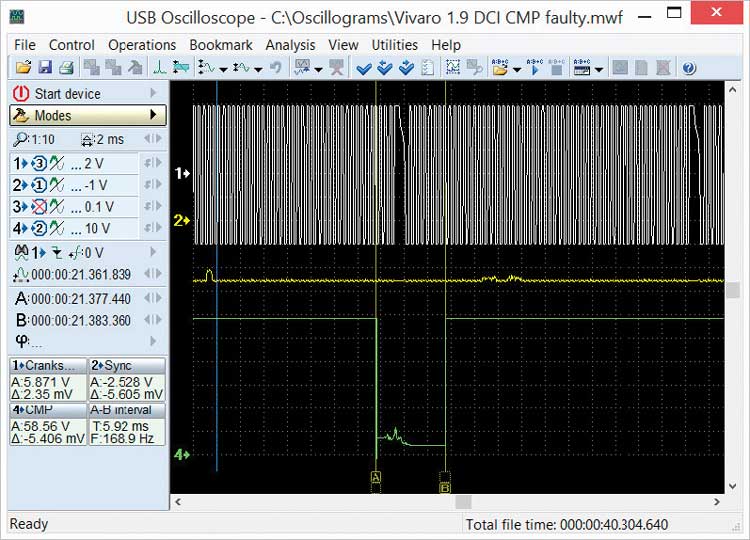
Note that finding this type of failure by visual inspection from the beginning of the waveform until the problem appears can be very difficult and time consuming. The reason is that the problem only appears for slightly less than 6 mS or 0.006 seconds out of a total of 20 seconds.
This tool or script makes it easy to check the camshaft sensor; however, more important may be the ability to check and verify the operation of a VVT (variable valve timing) system throughout it’s operating range. This is very difficult to accomplish using conventional means.
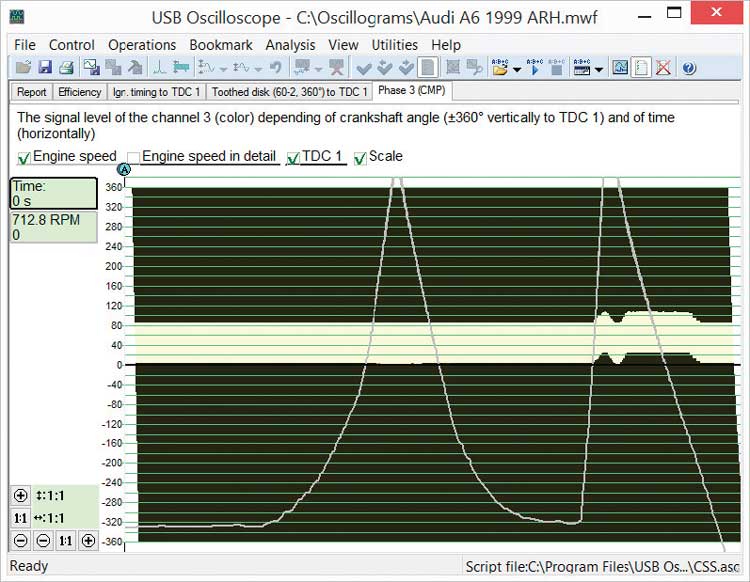
Figure 6 is an example from an Audi A6 ARH engine displaying the operation of the VVT system.
In Figure 6, the signal from the camshaft sensor is stable. Two throttle openings are displayed. The first opening is performed relatively slowly and smoothly. No shift in valve timing is evident. The second throttle opening is a “snap throttle” event where the throttle is opened very quickly. During this second throttle opening, the signal shifted 20° towards earlier valve timing. The tab clearly shows the operation of the VVT system. It is obvious that the camshaft timing shift only occurred during the second (snap) throttle.
During the diagnosis of variable valve timing, it may be desirable to record the current that controls the VVT solenoid in addition to the camshaft position sensor signal. In some cases, you may want to record the voltage at the solenoid terminals as well. Having the current signal along with the camshaft position sensor signal makes it possible to compare actual VVT operation relative to the control unit’s control. This could show sticky solenoids and/or actuators as well as the system’s response time. The solenoid is basically an electromagnet so the size of the current from the control unit directly affects operation of the solenoid and may be modified based on feedback from the camshaft position sensor.
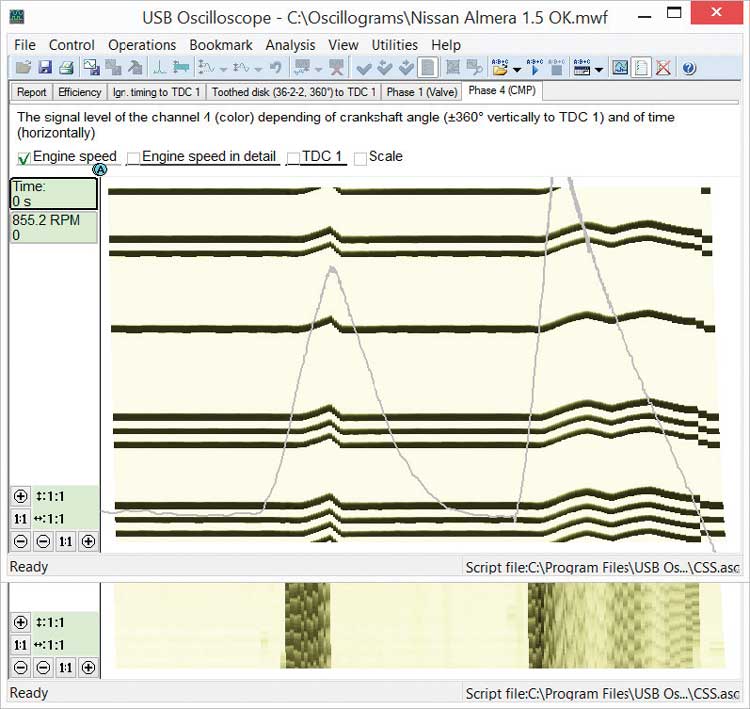
The example in Figure 7 was obtained on a Nissan Almera 1.5L during checking of the VVT system. At the same time as the signal from the crankshaft position sensor and the cylinder number 1 signal, the signal from the camshaft position sensor and the current signal from the VVT solenoid was recorded.
Two different “Phase” tabs from these signals can be viewed, one at a time. In Figure 7, the two tabs are arranged above each other and showing the same time frame for ease of interpretation. The first tab displays the signal from the camshaft sensor. The second displays the control current for the VVT system solenoid. Areas with increased control current are shown with darker color.
When analyzing these graphs, it is evident that the cam timing adjustment does not happen immediately as the control current is changed. To change the cam timing towards advanced timing takes some time. There is a noticeable delay in the response. When the control current is diminished, to change the cam timing back towards later timing, the mechanical change is near instantaneous, there is very little delay. We can also see that during the second snap throttle the control unit reduced control current, trying to keep the cam timing in the desired range.
Note that the tab shows changing voltage signal (vertical strips on the solenoid current graph) and signals that are varying in duration (horizontal strips on the graph of the camshaft sensor signal).
The “Phase” tab of the CKP script works well for analysis of control signals on ignition coils or injectors.
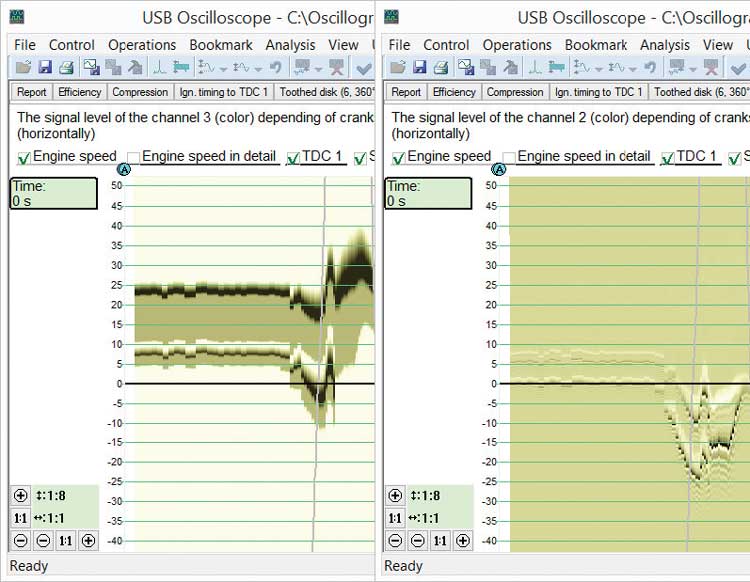
However, perhaps one of the more interesting uses for this tab is looking at injection control signals on diesel engines. Figure 8 is an example of an Audi A6 2.5 TDI engine equipped with a VP44 pump. This particular engine control system has implemented diesel pre-injection. For the purpose of this analysis, signals from the crankshaft position sensor, needle lift sensor of cylinder 1 injector and the current graph of the valve that control fuel injection quantity were all recorded.
In Figure 8, it can be seen that the first solenoid control pulse, which predetermines the amount of injected fuel has a significantly greater duration than the main injection pulse. However, the signal from the injector needle lift sensor indicates that the actual amount of fuel injected during the pre-injection event is actually less than the amount of fuel delivered during main injection and that the duration of both injection events is very similar.
It can also be seen that during higher rpm operation, the system reverts to single injection and the total amount of fuel is injected in one event.
Figure 9 shows the control signal on a Common Rail diesel injection system as found on a Renault Kangoo 1.5 dci equipped with a Delphi control system.
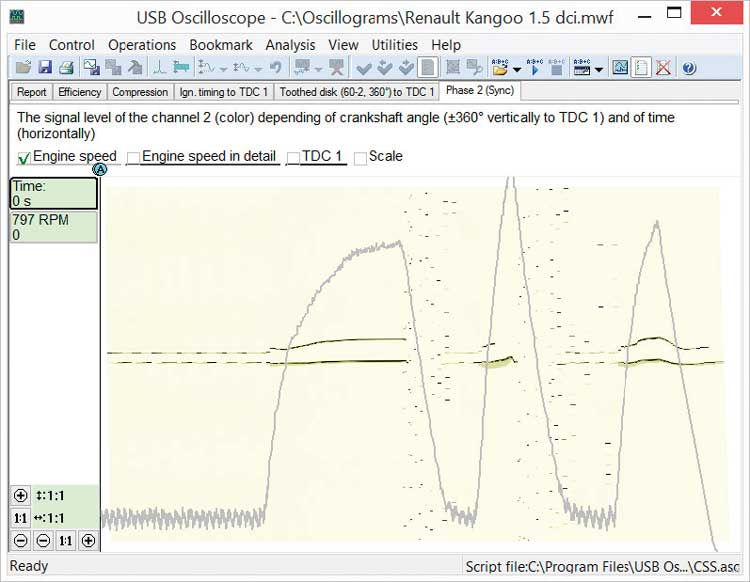
Figure 9 shows that the control unit performs a dual fuel injection, the first event is a short pre-injection and after that a main fuel injection. This graph also shows how the control unit has implemented control of the injectors as rpm goes down. The control unit produces a series of short un-synchronized injector pulses. These pulses are too short to open the injector and fuel is not injected into the cylinder. However, the force multiplier in the injector does have time to briefly open. For that reason, some fuel will flow from the injector and into the return pipe. The return fuel flow is controlled and used by the control unit to reduce the fuel pressure in the common rail when the control unit deems it necessary to do so. Note that the Delphi system increases the fuel pressure in the rail by increasing the fuel supply to the high pressure pump.
In closing, it should be noted that due to the “Phase” tab’s “smart” processing of the original signals, this script allows you to greatly simplify and speed up the analysis of waveforms taken from a variety of sensors and actuators of gasoline or diesel engines. This makes it possible to quickly identify both permanent and short-term deviations of repetitive or periodic signal’s phase, amplitude and duration.
More details and updates can be found at www.autoscope.eu.