Toyota engines have always been famous for their reliability and advanced technical solutions, including 1ZZ-FE – the firstborn of the ZZ series, traditionally characterized by a high level of manufacturability and quality. These engines replaced the reliable engines of A series in the late 1990s.
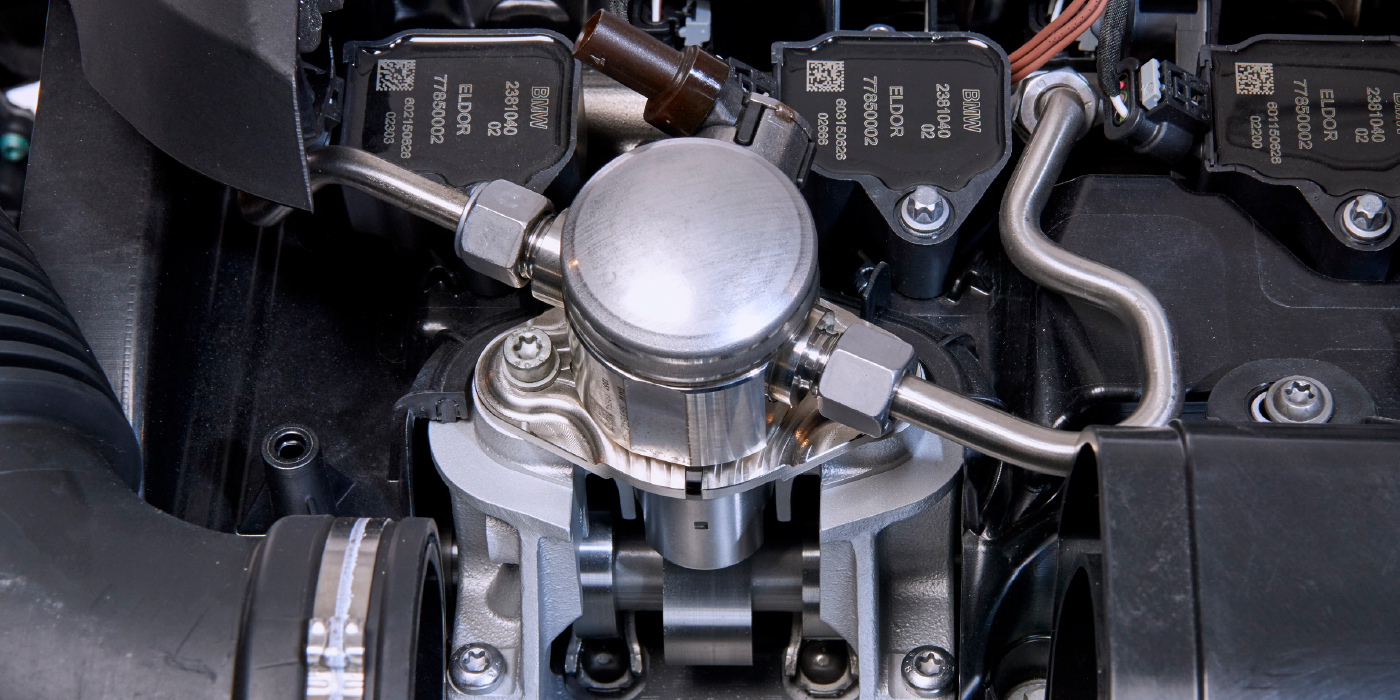
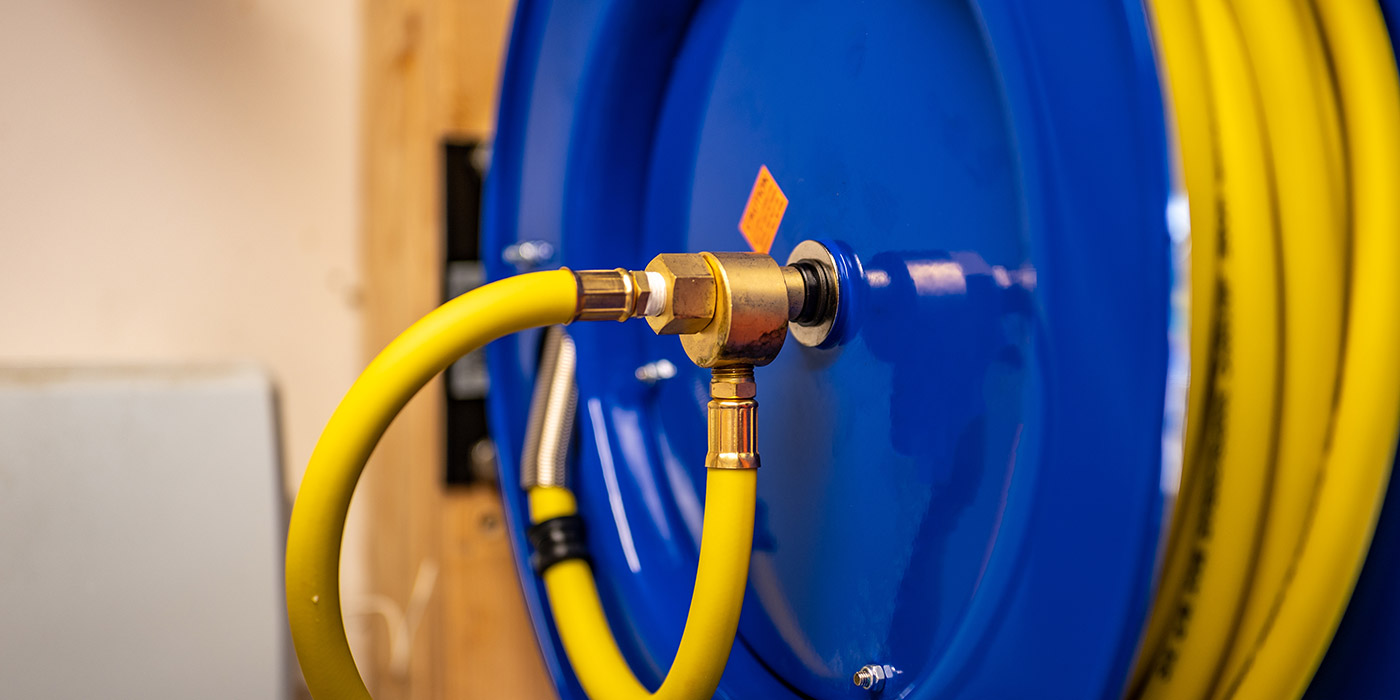
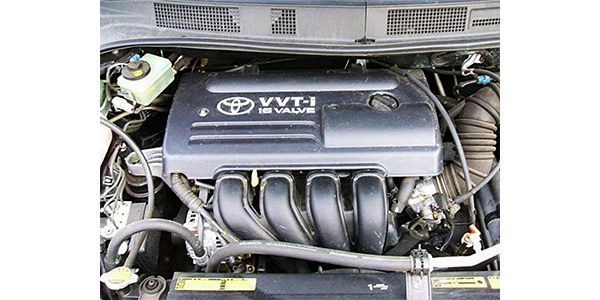
The 1ZZ-FE is a four-cylinder engine with 1.8 liter displacement, and relatively advanced for its age. The valve gear contains two chain-driven camshafts and 16 valves; the intake cam is equipped with VVT-i (Variable Valve Timing – Intelligent). Figure 1 is a typical installation of this engine.
A very controversial technical decision made by Toyota engineers was to use manually adjustable valve clearance. Even “back then,” hydraulic valve lifters were widely used. In addition, the valve adjustment process is fairly involved. It is necessary to use shims. The clearances on a cold engine are 0.15–0.25 mm for intake valves and 0.25–0.35 mm for exhaust valves.
The fuel supply is implemented using port fuel injection where the fuel is injected into the intake ports just ahead of the intake valves. The throttle plate is actuated using a cable from the accelerator pedal, or, in some cases, an electronic throttle.
The engine is designed for installation on cars with front-wheel drive. The global list of Toyota models equipped with a 1ZZ-FE engine is impressive:
• Avensis 220/250
• Caldina 240
• Celica 230
• Corolla 110/120/130/140
• Corolla Allex/Fielder/Runx/Spacio/Verso 120
• Corolla Matrix 130
• Corolla Altis 140
• Isis 10
• MR2 30
• MR-S 30
• Opa 10
• Premio/Allion 240/245
• RAV4 25/26
• Vista/Vista Ardeo 50
• Voltz 136/138
A very serious drawback of the 1ZZ-FE engine is difficult or limited repair-ability. If you have serious problems with this engine, the best option is often to just purchase a new or possibly a used unit.
Difficult repair-ability did not stop the owner of a Toyota Caldina equipped with this engine from having serious engine repair done. Three months after the repair (done elsewhere), the owner contacted us with a complaint of roughness and power loss.
Perhaps one the most ungrateful and difficult tasks for a technician may be to diagnose and eliminate problems caused by shoddy repair work or substandard parts. Why? Simply because defects arising during operation or due to normal wear and tear are completely predictable. But, those defects that exist due to poor repair techniques or parts can be very difficult to determine because the logic of their appearance can be absolutely… illogical. Philosophizing digressions aside, the car with the problem is waiting for us.
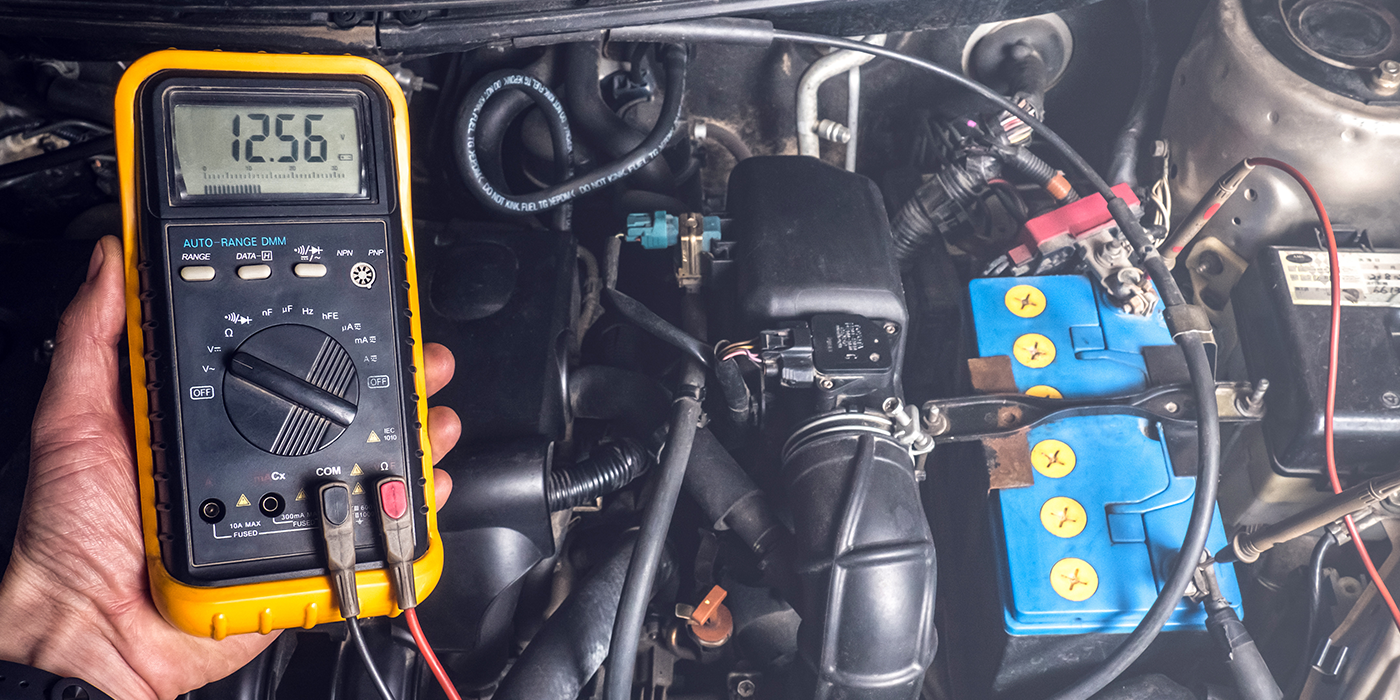
The simplest and most obvious first step is to connect a scanner and check engine parameters at idle. All parameters have typical values, seen every day. The only thing that was outside normal parameters was a small (within 10%) deviation from nominal fuel trim corrections. Since the engine is running so rough, this can be expected. The system is, after all, doing what it is designed to do, correct for variations in engine operation. No trouble codes were found in the ECU memory. The scanner did not provide any real clues as to the engine problem.
Another diagnostic approach is needed here; something along the lines of using an engine analyzer in some form or another, or doing a lot of manual work to try to come to a diagnosis. At the shop, we have a device called the USB Autoscope IV. This tester has a unique feature for comparing the operating efficiency of cylinders and, accordingly, searching for the causes of uneven engine operation. This is the irregularity test of rotation, also known as the CSS script.
The idea of this test is simple, like most good ideas are. During normal engine operation, the crankshaft’s angular velocity is uneven, the engine crankshaft RPM undergoes distinct changes. As an example, after each ignition, a piston thrust follows and the angular velocity of the crankshaft increases. This increase in speed after ignition, which is a measure of cylinder efficiency, is processed by the USB Autoscope software and displayed on the screen in the form of separate graphs for each cylinder. It should be noted here that the efficiency of the cylinder is conditional. There is a certain measurable efficiency. It is not horsepower or torque, but cylinder contribution. The main idea of the test is to compare the efficiency of the cylinders in different modes and obtain conclusions about the condition of the engine and its various components.
Suppose that one of the cylinders is less efficient. What could be causing this? Actually, there are only three reasons and they are widely known:
• mechanical part (usually loss of compression for whatever reason)
• fuel delivery (quantity, preparation)
• ignition system (spark timing, duration, location)
The task of the technician, then, is to determine, by the efficiency graphs, where the problem lies. The logic here is very simple. Let’s start with the ignition system.
Defects in the ignition system lead to misfire. Because of the nature of ignition systems, most all misfires will be total. In other words, either we have combustion or we do not. The efficiency usually cannot be reduced; it is either there or not. Therefore, a defect in the ignition system that causes a lack of spark, or a spark at the wrong time for a particular cylinder shows up as a repeated below zero failure in the efficiency graph. In addition, during the throttle snap, the cylinder with a malfunction will simply fall below the zero line and remain there all the time on the efficiency graph.
Unlike the ignition system, problems with injector or mechanical parts of the system tend to lead to a decrease in the cylinder’s efficiency. The actual amount of efficiency loss and under what conditions vary, depending on the nature of the problem. However, commonly the entire graph of a faulty cylinder drops below the rest of the cylinders in all modes of operation. How do we distinguish an injector problem from a mechanical (loss of compression) problem?
The solution is as simple as it is brilliant. At the end of the test procedure, we need to open the throttle all the way or close to it. Then, when the engine RPM reaches 3,000-4,000 RPM, turn off the ignition, while still holding the throttle open. The engine will slow down and stop, due to lack of fuel and spark. However, air is entering the cylinders and compression occurs. After TDC (top dead center), the compressed air will push down on the piston, causing less of a loss of crankshaft angular velocity. Thus, the higher the pneumatic density of the cylinder, the higher the graph of its effectiveness. Therefore, the tail-end of efficiency graphs can be used to estimate a cylinder’s compression.
As a side note, most engines are now equipped with electronic throttle, often known as TAC, for Throttle Actuator Control. Often, there is no simple way to hold the throttle open during shut-down on these. However, default throttle plate position is a fast idle, so sufficient air for diagnosis will probably enter the cylinders in any case. Should it not be sufficient air for diagnosis, one solution would be to create a large vacuum leak just as the engine is shut down. Or some work around to keep the throttle plate open may need to be devised.
So, after performing the CSS test, we can estimate or diagnose the mechanical part of the engine by the appearance of the concluding part of the graphs. By repeatable, regular graphical dips below the zero line we can make a diagnosis about the condition of the ignition system, and finally, by an overall lowering of the efficiency graph of one cylinder relative to the other cylinders about the condition of the fuel injector.
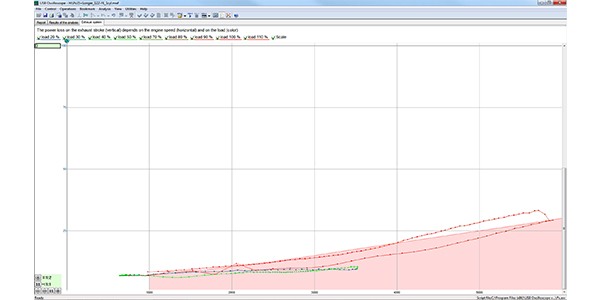
The test can be performed very quickly, inside of just three minutes. To perform the CSS test, connect the USB Autoscope to the crankshaft position sensor and attach the ignition synchronization probe to the spark plug wire or ignition coil for cylinder No. 1. We perform the test as instructed by the software and obtain the efficiency graphs of the cylinders of our engine. In Figure 2, the red graph is a graph of the efficiency of cylinder No. 1.
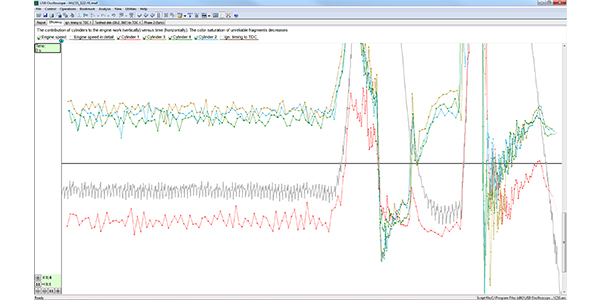
The problem is indeed present, and it is a serious one. The graph clearly indicates a mechanical problem. At idle, cylinder No. 1 did not contribute any power, and only during throttle application did the cylinder show any efficiency at all, it’s efficiency rose above zero, but was much lower than in the other cylinders.
Since the end of the graph indicates problems with the mechanical part, we proceed to manually measure compression and we get the following result:
• Cylinder No. 1: 5 bar (72.5 psi).
• Cylinder No. 2: 16 bar (232 psi).
• Cylinder No. 3: 16 bar.
• Cylinder No. 4: 16 bar.
The results are strange. In cylinder No. 1, there is a clear loss of compression, as evidenced by the low compression pressure. But what about the other cylinders? The compression ratio is clearly way too high. What is causing the high compression ratio? To refine the diagnosis, we are again enlisting the help of the USB Autoscope IV and the associated software. This time we are using the cylinder pressure transducer. We proceed to test all the cylinders so we can compare the results. Figure 3 shows the result from cylinder No. 1.
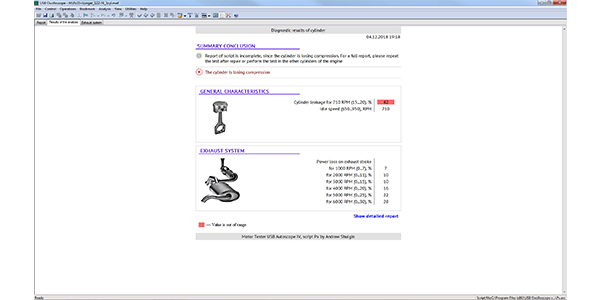
Cylinder leakage at 710 RPM was 42%. This is a very large value, the loss of about 15% is considered the norm, and the maximum allowable is up to 20%. Also, on the tab “Exhaust system” increased resistance to flow in the exhaust system is noted, as shown on Figure 4 .
The graph shows that there is a blockage in the exhaust system, but only partial. The reason for this diagnosis is that the graph of the power losses during the exhaust stroke only slightly exceeds the allowable limit.
We continue the diagnosis and Figure 5 shows the test results from cylinder No. 2.
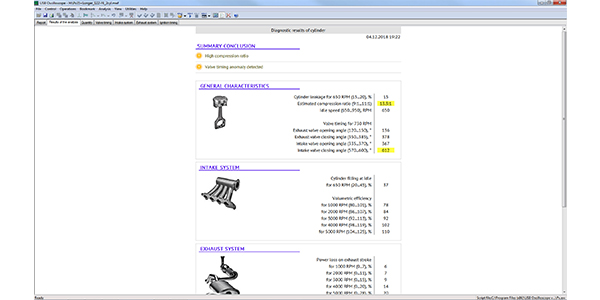
Now we see the cause of the very high (16 bar) compression pressure. The engine has an excessively high compression ratio of 13.3:1. According to service information, the normal compression ratio of this engine is 10:1. As for the angle of the intake valve closing shown in yellow; the engine is equipped with the variable valve timing VVTi system, and at idle the intake valve closes very late.
In addition to what is seen in the accompanying figures, the USB Autoscope software automatically calculated a number of parameters such as:
• Ignition timing
• Amount of air entering the cylinders (volumetric efficiency)
• Power loss due to exhaust system restriction
All of these calculations are done relative to the engine RPM (crankshaft angular velocity).
The data obtained clearly indicated a need for engine disassembly and repair. We obtained the owner’s consent and proceeded with engine disassembly. The first thing we checked, however, was valve clearances.
In cylinder No. 1 the exhaust valve clearance was literally zero. Since there was no clearance, the valve could not fully close, especially hot, since metal expands as it heats up. The lack of clearance explains the severe loss of compression pressure.
As can be seen in Figure 6, a liner (or sleeve) had been installed in the bore for cylinder No. 1. Apparently, this cylinder was heavily damaged at some point.
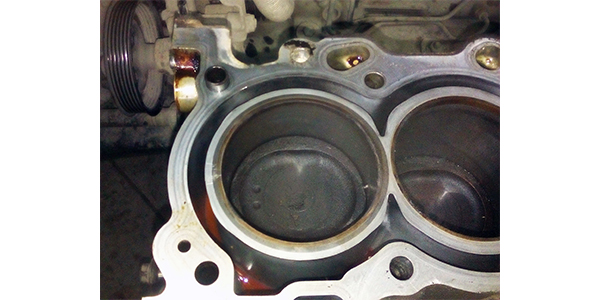
The sleeve installation was done correctly and it is an acceptable repair. In fact, the sleeve is often made from more durable material than the block itself and the repaired cylinder should last as long as or longer than the other cylinders.
What about the excessive compression ratio in the other cylinders? When measuring the height of the cylinder head, it was significantly lower than specifications according to our service information. Apparently, the engine had been severely overheated, warping the head. Somebody milled the head to restore flatness. Since this reduced the size of the combustion chambers, compression ratio increased.
Unfortunately, the only acceptable repair option in this case is to replace the cylinder head. Why? An increased compression ratio will inevitably lead to spark knock and damaging detonation. The knock sensor will detect the knock and the ECU will delay or retard the ignition timing. The delayed ignition will cause loss of power and increased fuel consumption.
Figure 7 shows the inside of the catalytic converter, which became accessible as we disassembled the engine.
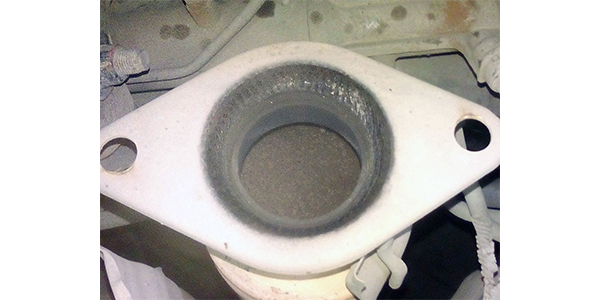
The view in Figure 7 explains the increased exhaust system restriction found by the software. The converter is not completely clogged, but the openings are obstructed from combustion byproducts and engine wear material.
There are some obvious lessons to be learned from this case. Any competent engine diagnostics is based on working with equipment. A scanner may not be of any appreciable help, especially on older vehicles. In many cases, a dedicated engine tester such as an oscilloscope with the appropriate probes and software is needed. Additionally, equipment that can analyze the signals and output the results in the form of tables or text is a great help and time saver. We did not need to go deep in to the engine during our diagnosis, the CSS script with the help of the pressure transducer told us what was and what wasn’t good.
Let’s remember how many problems we found with the help of an engine analyzer on this engine:
• A mechanical problem in cylinder No. 1 (low compression)
• Increased back pressure in the exhaust system
• Increased compression ratio due to a machined cylinder head
All of these problems were easily found without any engine disassembly being necessary. Afterwards, the technician could confidently recommend a mechanical tear-down, based on the results of the CSS script diagnosis. The problems found meshed perfectly with the test results. It is far better to have a good idea of what you will find when selling diagnostic and repair time to a customer rather than guessing. T