by Gary Goms
 Although digital storage oscilloscopes or “lab scopes” have now become standard equipment for most modern automotive repair shops, they still possess a mystique that tends to intimidate many technicians.
Right off the top, a lab scope is basically a voltmeter that displays voltage signals along a time base. The vertical scale measures the amplitude or amount of the voltage and the horizontal scale measures an incremental time line along which the signals are displayed.
The mystique of the DSO “lab scope” developed during the pre-1996, OBD-I era, when on-board self-diagnostic capability was very limited. Most engine control modules (ECMs) could only detect open, shorted and shorted-to-ground circuits in most sensors and actuators.
 Most had only a very limited capability to rationalize or compare sensor inputs and process that data into a diagnostic trouble code (DTC).
The DSO became an overnight sensation in the diagnostic community because, for the first time, technicians had the capability to actually display and analyze voltage signals in electrical circuits.
A technician could, for example, see how an ECM “sees” the compression stroke when it compares the camshaft position (CMP) input signal with the crankshaft position (CKP) input signal.
Today, the aftermarket supplies DSOs ranging from basic hand-held scopes to very advanced PC-based multi-channel versions with prices ranging from about $1,000 to over $4,000.
Some mid-grade and high-end DSOs include diagnostic databases, which can be a real time-saver for any diagnostic tech.
 Other scopes concentrate on multi-channel, high-definition glitch captures, which are vital for advanced electronics diagnostics. Some scan tools include a basic scope function, but for our purposes, we’ll leave these out of the discussion.
On the other hand, don’t forget that a professional-level scan tool, multimeter, high and low-amp current probes and a vacuum pressure transducer are required to complete the average technician’s diagnostic tool inventory.
At times, I’ve had all of these tools attached to the same vehicle when trying to diagnose an intermittent fault.
So, if you have a DSO in your toolbox, you’re also going to want these other basic tools to complete your basic diagnostic capabilities.
 Buttonology
Now that we have the basic history out of the way, let’s concentrate on how you can most effectively use all of the features and capabilities that are built into your DSO. Just for practice, experiment with using each of the features built into your DSO by scrolling through its menus.
If, for example, your DSO can store and retrieve screens or “movies,” learn how to do that quickly and reliably. Only when “buttonology” becomes an automatic response will your DSO perform as it was designed.
Basic Set-Ups
Let’s begin with a basic set-up by analyzing, for example, a Ford manifold absolute pressure or MAP sensor.
 Check your DSO to see if it must be set to DC coupling. Some DSOs require this, some don’t.
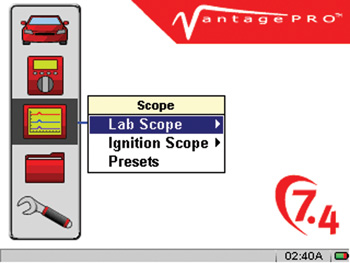
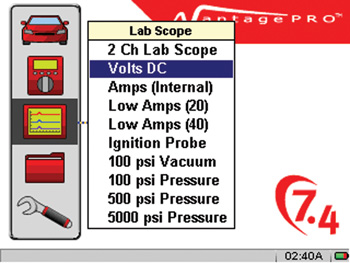
But, to illustrate, see Photo 1 for the “buttonology” on a Snap-on Vantage Pro DSO: First, go to “lab scope” and then to “volts DC,” (Photo 2) which is a single-channel display.
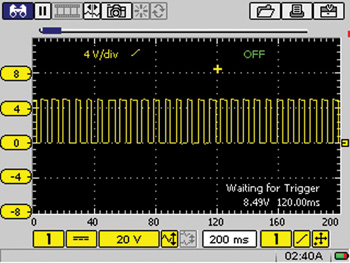
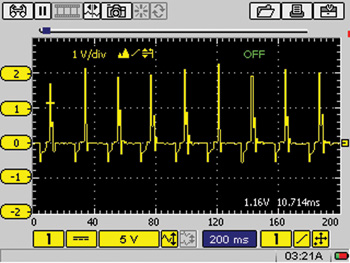
The final result (Photo 3) is a single-channel display with a range of 20 volts and 200 milliseconds (ms) on a time base set at 40 ms increments.
Although some DSOs might display a numerical frequency value, it’s important to be able to convert a DSO display into a usable numerical value.
When carefully counted, a total of 27 square-wave patterns are being displayed in a frame of 200 ms.
 Because there are 1,000 milliseconds in one second, we divide 1,000 by 200 to see that it takes five screens to fill one second in time. So we multiply 27 x 5 to arrive at a total frequency of 135 per second or 135 hertz (Hz).
At an uncorrected barometric pressure of about 22.2” Hg, 135 Hz is close to the key-on, engine-off MAP frequency for my approximate altitude of 8,000’.
Secondary Ignition
The DSO can be used to display secondary ignition on distributor (Photo 4), distributorless and coil-on-plug engines using spark plug wires.
Different DSOs obviously use different menus to get into ignition displays. With the Vantage Pro, go to the “ignition probe” section of the lab scope menu to automatically adjust the display to the attenuation value of the Vantage Pro’s inductive probe.
 If done correctly your display should look like Photo 5.
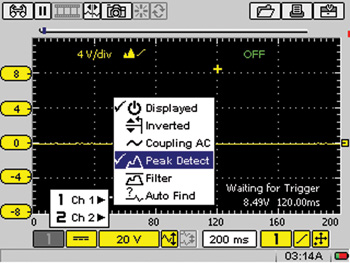
If your DSO doesn’t have an “ignition” menu, select channel 1 and then select “Peak Detect” on the appropriate menu.
Most DSOs use the term “peak detect” to indicate that the peak secondary voltage or firing spike will be displayed. If the “smooth” display is used, the firing spike won’t appear.
Because most distributor-type secondary ignitions fire in reverse polarity, select the “inverted” display mode.
In a pinch, the polarity on the inductive pickup leads can be reversed to display secondary ignition. If you’re displaying distributorless or coil-pack ignition, remember that one-half of the spark plugs fire on positive polarity and the other half on negative polarity.
Inductive adapters are available for testing coil-on-plug ignitions.
Never attempt a direct connection to primary or secondary voltage because direct exposure to primary or secondary voltage will ruin many DSOs. See Photo 6.
 The next step in displaying a waveform from a distributor or coil-pack ignition is to attach an inductive pickup designed to display secondary ignition signals.
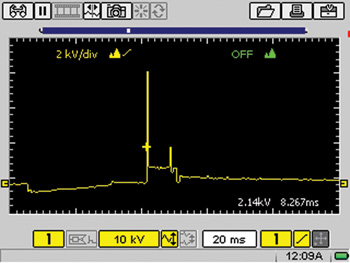
The inductive pickup can be attached to a single spark plug wire to produce a display like Photo 7.
Notice that we’re on the 200-volt scale at 20 ms. The voltage spike reaches 140 volts before the spark jumps the spark plug gap. Notice that the small “+” indicates that the trigger function is set at about 60 volts.
If an inductive probe with a 100:1 attenuation ratio is being used, multiply the indicated peak voltage of 140 volts times 100 to arrive at 14,000 volts or 14 kV at idle.
If you’re in doubt about the attenuation ratio of your pickup, remembering that most engines idle at about 12-14kV will get you in the ballpark on kV.
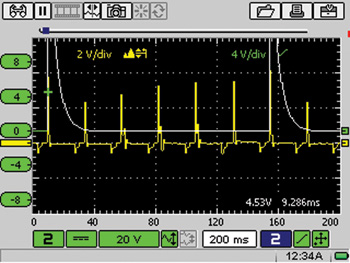 Next, let’s attach the inductive probe to the coil wire to produce the result in Photo 8.
As you can see, there are nine cylinders firing within the selected 200 ms time base. Keep in mind that the cylinder display at the far right is firing spike portion of the cylinder display on the far left.
Since a six-cylinder engine is being tested, start from the signal at the far left with the “+” trigger display superimposed and count six cylinders to the right.
Notice, too, that the second and sixth cylinder displays show a firing irregularity.
The only problem here is that number-one cylinder can’t be identified in this display, so the offending cylinders can’t be identified.
To identify cylinder number one, attach an inductive trigger probe to number-one spark plug wire. If the pattern isn’t consistent, flip the pickup 180° on the spark plug wire.
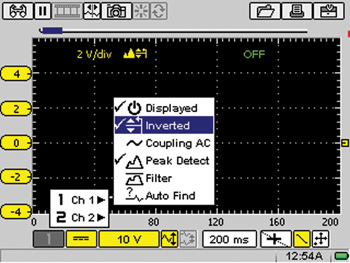
 Next, cancel the trigger feature on channel 1.
Activate the trigger on channel 2 to create a trigger source and adjust your display to superimpose both channels. The trigger should be adjusted high enough to stabilize the display.
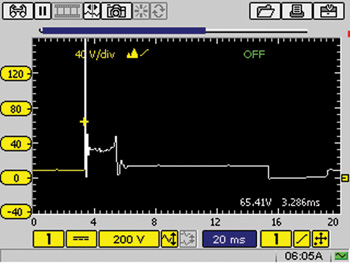
While some DSO menus may vary in how the triggers are set, you should see a display like Photo 9.
In this frame, I left exaggerated the trigger pattern to illustrate the procedure. Notice that the “+” on number-one cylinder indicates the amplitude at which the trigger is set.
The second green square at the bottom indicates that the trigger is set on a rising waveform pattern for both channels 1 and 2.
While we’re not delving into the relatively deep subject of secondary waveform interpretation in this space, keep in mind that some very excellent instruction manuals about this very subject are sold on several different Internet sources.
Also check with your jobber or automotive service association for local classes. Another excellent source is the International Automotive Technician’s Network’s (iATN) Events forum, which lists many area classes.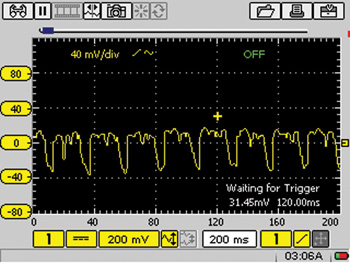
AC Coupling
Alternating current or AC coupling is another feature that any diagnostic technician should be using to display waveform information. Follow the menus on your DSO until you find “AC coupling.” See Photo 10.
The AC coupling displays only the alternating voltage component of the signal. This feature is handy for diagnosing bad alternator diodes and for looking at minor pressure or vacuum variations produced by various pressure transducers. See Photo 11.
Thinking Out of the Box
Intermittent failures are the toughest to diagnose. Always keep in mind that the DSO is essentially a voltmeter that displays voltage over a time frame.
When you become familiar with the trigger menu, for example, you might find yourself using the “normal” trigger to catch glitches in a square-wave or a sinusoidal waveform.
As opposed to the automatic or “auto” trigger, the normal trigger freezes or holds any variation or irregularity in the waveform.
Some DSOs are so sensitive to irregularities that it’s hard to capture a relevant waveform. The normal trigger on other DSOs works very well to capture intermittent signal drop-outs.
 One method of capturing a drop-out on an irregular secondary ignition waveform using the normal trigger is to capture the event using the DSO’s “movie” or buffer feature. This will allow the failure to be captured without using the normal trigger. It also allows the technician to review a complete series of cylinder or sensor events leading up to the point of failure.
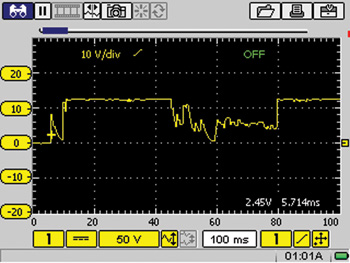
In some cases, I’ve used the DSO’s normal trigger for wiggle-testing wiring harnesses and connections. To illustrate, Photo 12 shows a display of a wire brushed across a battery terminal.
In other instances, the auto trigger can be used to monitor voltage drops across connections and various ground circuits. The rule of thumb for voltage drops on 12-volt circuits is about 500 mV. The rule of thumb for electronic circuits is a maximum of 100 mV, with less than 50 mV being the most desirable.
Summary
Mastering the above “generic” techniques will go a long way toward improving your professional awareness of technical issues and your proficiency in using a DSO. In many cases, the DSO is the “indispensable” tool you need for verifying faulty sensors, actuators, wiring and connectors.
If you’re working on a multiplexing or bus communications problem, you can use a DSO to verify the presence or absence of a bus communications signal. What-ever the case, a modern DSO is the indispensable tool for the modern diagnostic technician.