The use of pressure transducers and pressure waveform interpretations have become a fairly hot discussion and training topic. Several automotive oscilloscope manufacturers offer pressure transducers, often as an optional add-on to their kits. Many standard kits include a low-pressure and a high-pressure transducer or probe. The low-pressure device should have a range of approximately +/- 1 Bar (+/- 14.5 psi).
In order to efficiently and accurately use a low-pressure transducer (or, as is often commonly referred to as “vacuum” — remember that “vacuum” is just low pressure relative to ambient pressure), you have to be able to “think outside the box” and have a good feel and understanding of how an engine operates. With a good feel and understanding of how an engine operates, the information obtained with the transducer will be understandable.
It takes a great deal of experience to understand engine operation to the level necessary for successful pressure transducer waveform diagnosis, and beginning technicians will invariably struggle, perhaps even get frustrated with the process.
A possible reason for this difficulty is a lack of generally accepted methods for analyzing pressure transducer waveforms. One very useful technique is to look at low-pressure waveforms in the intake manifold while using the starter to crank the engine. This method helps with detecting problems in the mechanical part of the engine easily and quickly.
Other techniques are to evaluate the low-pressure waveforms in the crankcase and the exhaust system and to analyze the low-pressure waveforms in the intake manifold on a running engine.
In all of these cases, the shape of the pressure waveforms will, to a large degree, depend on the design of the intake manifold. For that reason, engines with different manifold designs will have significant differences in the shape of the pressure waveform. This can cause difficulties in diagnosing problems using intake manifold pressure waveforms.
Further, the shape of the low-pressure waveform in the intake manifold depends on where on the manifold the transducer is attached. The waveform also depends on the length of the connecting hose between the pressure transducer and the intake manifold.
If you spend your days working on the same model vehicles and engines, you will quickly develop a good understanding of the waveforms and know how certain defects look. But what if you have a Nissan today, a Volkswagen tomorrow and a Ford the day after tomorrow?
The best way to learn is by doing. Technicians can very successfully use pressure transducers in their work. Here is our most recent example of pressure transducer diagnosis.
The vehicle we are diagnosing is a Volkswagen Passat B5, equipped with the 1.8 ARG engine. This vehicle was produced between the years of 1996 and 2005 and had a relatively advanced engine with variable valve timing, five valves per cylinder and variable intake manifold runners.
This particular Volkswagen had developed some problems. Most noticeable was a rough idle and loss of power. Before the vehicle came to us it had made the rounds to several shops for about three months. The spark plugs, plug wires, fuel pump and the oxygen sensor had already been replaced. The latter twice, with OEM parts.
The fuel filter had not been replaced, but the injectors had been cleaned. The final suggestion was to replace the ignition control module (ICM) and ignition coils.
The vehicle owner had had enough of this expensive guesswork and finally brought the vehicle to us to see if we could find what the real problem was. Even if a number of parts had been replaced, that is no guarantee that the replaced parts are good, so we decided not to rush the analysis. The engine is clearly misfiring, it is idling very rough and distinctive pops are clearly audible at the tailpipe.
A hand placed on the tailpipe is pushed away as it should be. However, randomly, the hand is also pulled toward the tail pipe, indicating a misfire.
A logical next step is to connect a scanner, check for codes and review engine data. Oddly enough, there are no misfire-related trouble codes. There could be any number of reasons for a lack of misfire codes — perhaps they were erased and the control unit has not had time to set codes yet. Whatever the reason, let’s consider the reasons for an obvious misfire.
Experience has shown that ignition system problems are the most common cause of misfires. The second most common cause is mechanical defects, mostly valvetrain problems such as burnt valves, while fuel delivery problems are the most seldom encountered issue.
We proceed to check the ignition system, which is an uncommon system in this case. It is a distributorless ignition system (DIS) where two coils are combined into one housing which are then installed directly onto the spark plugs of cylinders #3 and #4 using a spring and a plug boot. The other towers on these ignition coils are then connected to cylinders #1 and #2 using ordinary plug wires. The ICM, equipped with a large heat sink, is bolted to the valve cover.
This design is a little bit challenging to work with since it is difficult to obtain ignition secondary waveforms from cylinders #3 and #4 and the spark plug tubes are deep. Nevertheless, with some work, we obtained the high-voltage waveform as shown in Figure 1 and analyzed it.
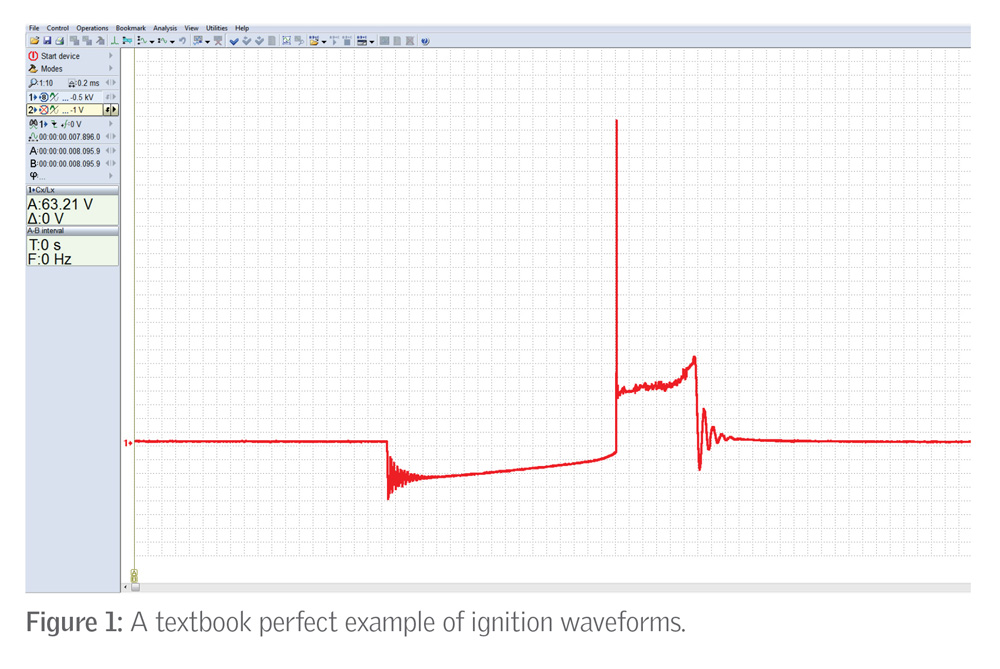
In all four cylinders, the waveforms are as they should be; a few damped oscillations after the extinction of the spark, a straight spark burn voltage line and a burn time of about 1.15 ms. Why was it recommended to replace the ignition coils and ICM? Probably just guesswork. We perform a visual and electrical check of the ignition system components such as the plug wires and find no obvious problems.
Next, we look at the breakdown or ionization voltage of the cylinders. The breakdown voltage is dependent on a number of factors, one of the more important ones being the pressure in the cylinder during the spark event. Lower pressure means lower breakdown voltage. We run an automatic analysis of the waveform and the results show that the breakdown voltage in cylinder #1 is much lower than in the others.
The appearance of the analysis graph strongly points to lowered pressure in cylinder #1 during high voltage breakdown, most likely caused by lowered compression in that cylinder. A small spark plug gap could cause the same appearance, but the gaps were checked during initial visual inspection. The reason for the lowered compression is undetermined at this time.
We can use a compression tester, or better yet, a leak down tester for the final determination, but since our USB Autoscope IV is already installed and connected to the engine, we decide to experiment a bit. We use the low-pressure transducer to see how the misfires affect the pressure waveforms in the intake manifold and in the exhaust tailpipe. We want to ferret out any interaction between the spark in cylinder #1 and the deviations of the waveform shape.
We start by connecting the low-pressure transducer to the plenum of the intake manifold. The shorter the connecting hose we use, the less distortion there will be on the shape of the pressure waveform. In order to synchronize the waveform to the engine, we use the already-connected synchronization probe that’s attached to the cylinder #1 plug wire.
The measurement is performed while cranking the engine using the starter. The engine is inhibited from starting by disabling the injectors. The pressure waveform from an engine in good working order should be similar to a sine wave with even peaks. Figure 2 shows that this is not the case with this engine.
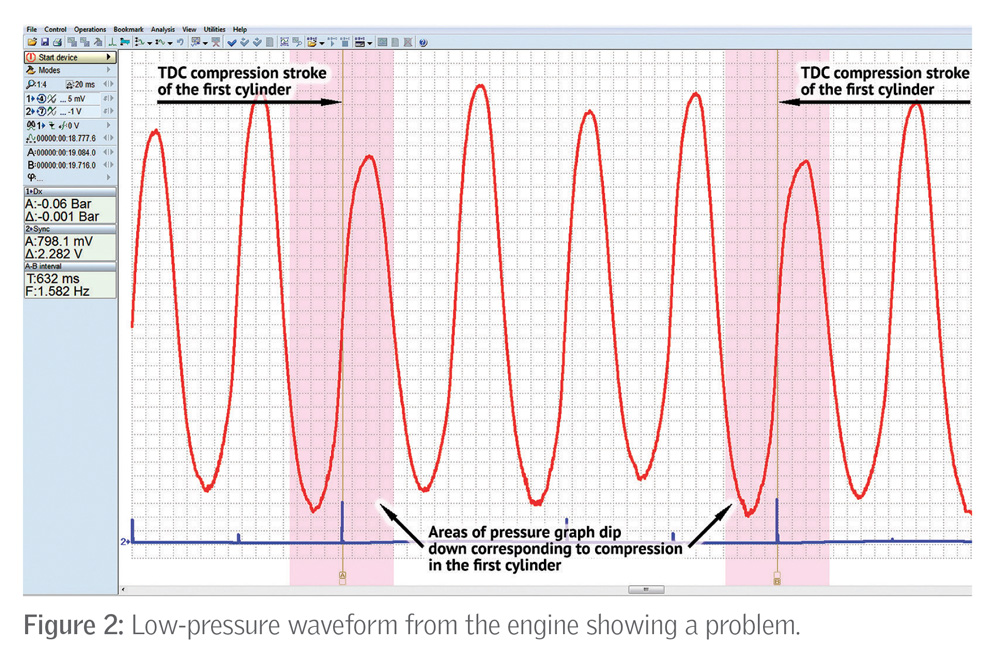
The upper red graph is the pressure in the intake manifold. The lower blue graph shows the timing signal from the first cylinder. Since this is a DIS system, a high pulse corresponds to a spark in cylinder #1 and a low pulse corresponds to cylinder #4, the companion cylinder.
While cranking, the engine control system will generate a spark very close to TDC on the compression stroke in the cylinder. Therefore, it can be argued that at the moments noted in Figure 2 and corresponding to the timing moments, the piston of cylinder #1 was very close to TDC compression.
An engine crankshaft rotates with uneven speed during cranking. The maximum deceleration of rotation occurs around TDC where resistance to rotation is the largest and the higher the compression in the next cylinder, the greater the deceleration.
An important point: the pressure graph in the intake manifold is higher or lower depending on the angular speed of the crankshaft rotation. All other things being equal, the higher the rotation speed, the lower the pressure graph will be located (which, if you prefer, is equivalent to a larger vacuum).
This means that if the compression is reduced in a cylinder, the angular velocity of the crankshaft during the passage of TDC in that cylinder will be higher than in the others, and the corresponding section of the graph will go lower.
Back to Figure 2: the pink background marks TDC compression areas of cylinder #1. They went down, which means the angular velocity of the crankshaft at that moment was higher than in the neighboring cylinders. It means that the compression in the first cylinder is lower than in the others. Simple as that!
It is also seen that cylinder #4 has a slightly decreased contribution; apparently, nowhere as serious as cylinder #1 and misfires are not observed here.
A decrease of the cylinder compression can mainly occur for two reasons. The first is wear or sticking of piston rings or a burned-through piston. If there is a piston problem, combustion gases from the cylinder will enter the crankcase, causing pressure waveforms in the crankcase. The second reason is burned or stuck open valves. The exhaust valves are much more likely to be a problem than the intake valves, due to more heat loading.
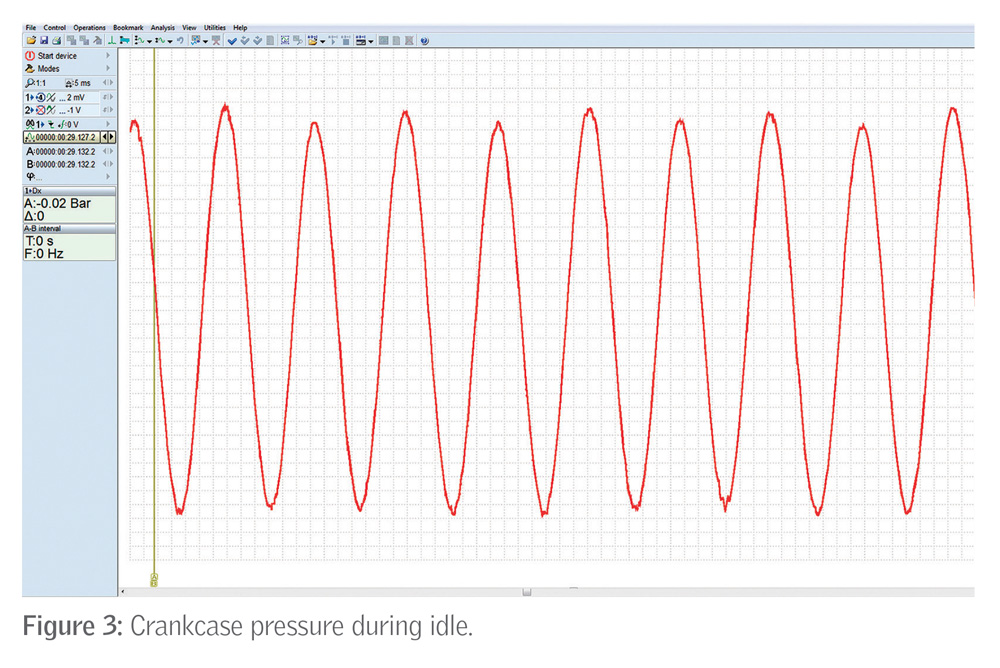
Let’s see how the pressure of the crankcase gases behaves during engine operation and find out exactly what the defect of the first cylinder is — the rings or the valves.
Figure 3 shows the result from measuring crankcase pressures while idling, which is slightly lower than ambient, or a slight vacuum, about 0.015 Bar. This is caused by the PCV system operating and is normal. The main observation is that all the pressure surges are minor, with no surges or spikes evident on the graph. This means that there are no problems with the rings or the piston in cylinder #1. The problem is a valve, and most likely an exhaust valve.
Let’s make another experiment or measurement, because, why not? We are going to capture the waveform of the exhaust gas pressure. Syncing to the ignition event in cylinder #1, we will again make sure that the problem is in that cylinder.
There is a problem: the low-pressure transducer leads are too short to fit the sensor in the tailpipe. We could mount the tester closer to the tailpipe, but then the synchronization probe lead is too short to reach the oscilloscope. It is very important for us to see the moment of ignition, so we improvise, take the hose from a vacuum cleaner, attach it tightly on the exhaust pipe, pull it to the front of the car and prepare everything for measurement.
Now, of course, the hose itself is the cause of the excess vibrations of the exhaust gas, so the shape of the waveform in Figure 4 is somewhat scary, but it is still quite possible to figure out and draw the necessary conclusions.
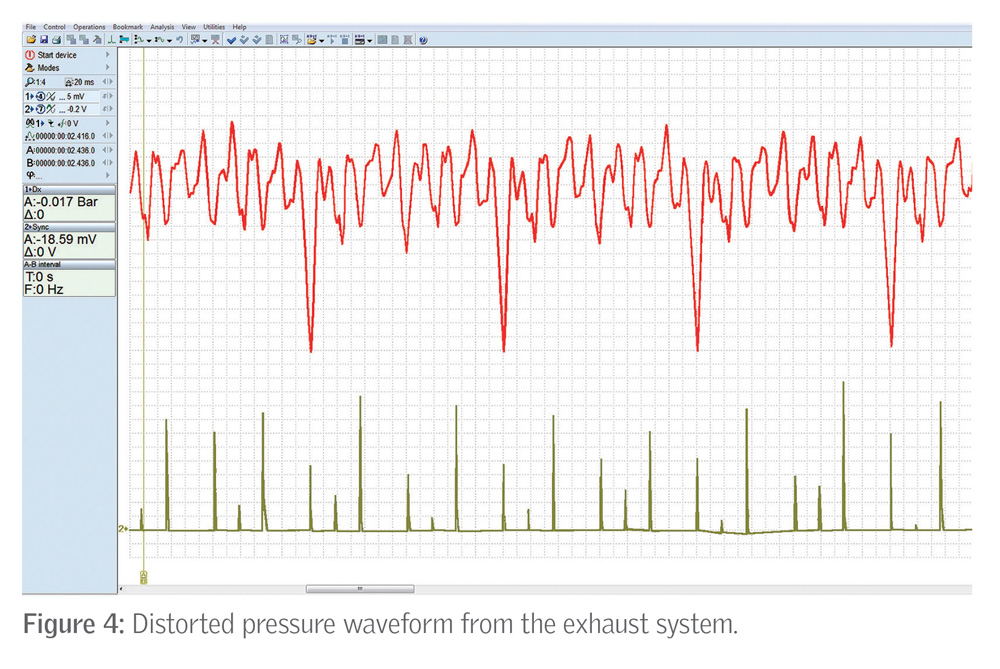
You can see periodic dips in the pressure graph. They are felt by hand and heard by ear. We need to find out which cylinder is causing the problem. But before we do this, let’s think a little.
Imagine that we installed a transducer at the beginning of the exhaust system next to the exhaust valves, in place of the oxygen sensor. Let us try to understand how timing moments and the moment of maximum pressure in the exhaust system will relate to each other.
To begin with, at idle (not on all engines, but on most), the spark occurs in the 0°-10° range before TDC. So far so good. And when does the exhaust gas pressure peak occur? That’s a little more complicated. The exhaust valve (again, not on all engines, but on most) opens around 130°-150° after TDC compression. In other words, it opens on the working stroke. At the time of the valve opening, the exhaust gases are under high pressure and begin to escape from the cylinder, this is before the piston reaches BDC (bottom dead center). By the time the piston reaches BDC, 80% of the exhaust gases have already left the cylinder.
This phase — from the moment the exhaust valve begins to open before BDC — is called the free exhaust phase. And since almost the entire mass of exhaust gases leaves the cylinder during the free release phase, it is logical to assume that the maximum pressure in the exhaust manifold arises somewhere at the end of this phase.
In other words, from the moment of ignition to the moment of maximum pressure behind the exhaust valve, approximately 180°, or a quarter of the engine’s duty cycle passes. This is a rather crude calculation, but in our case, this accuracy is good enough.
Does it mean that having counted a quarter of the working cycle from the spark of a certain cylinder on the graph, we will see a surge (or failure in the case of ignition failure) of this particular cylinder? In the case when we are located right at the exhaust valve — yes. However, we are not measuring at the exhaust valve, but at the tailpipe. Not only that, we also have a hose going forward from the tailpipe to the front of the vehicle. The pressure wave or pulse needs to travel the length of this complete assembly, right?
At what speed does a pressure wave propagate in free air? The answer is simple: with the speed of sound, 330 m/s.
Of course, the exhaust gases are not exactly air, but the speed of travel is comparable. The hose has a length of 4 m, the exhaust system on this vehicle is about 6 m, due to all the bends from the engine exhaust ports to the tailpipe. This means that the pressure wave travels from the exhaust valve to our pulsation transducer in about 30 ms. We must include this delay in our measurements!
We get back to the graph as shown in Figure 4, zoom in a little for convenience and carry out several simple calculations and measurements as shown in Figure 5 and explained below.
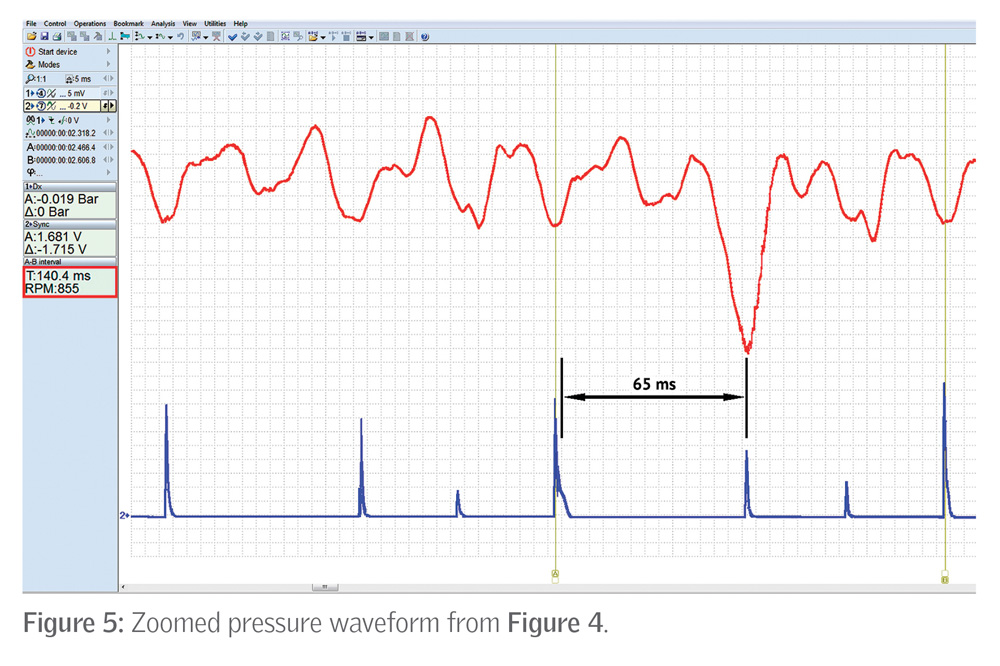
We position the measuring rulers on two adjacent sparks of cylinder #1 and find out that one complete cycle is 140 ms (outlined in red on the left). So a quarter cycle is 35 ms. It’s easy to see and calculate that the delay of the pressure graph relative to the spark is 35 + 30 = 65 ms.
We position one ruler at the moment of the pressure drop and shift the second ruler to the left by 65 ms. Why to the left? Because the spark shows up instantly on the graph and after 65 ms, a pressure surge appeared (or did not appear) at the end of our hose. We are measuring from the pressure dip.
Having positioned the rulers, we pinpoint almost exactly at the moment of spark in cylinder #1. So, the problem is diagnosed in yet another way. Some will say: “Was all this measuring and testing really necessary? After all, you could just measure the compression in the cylinders.” Very true, but the inquiring mind of a technician wants to know and learn. And, as we said earlier, the best way of learning is by doing.
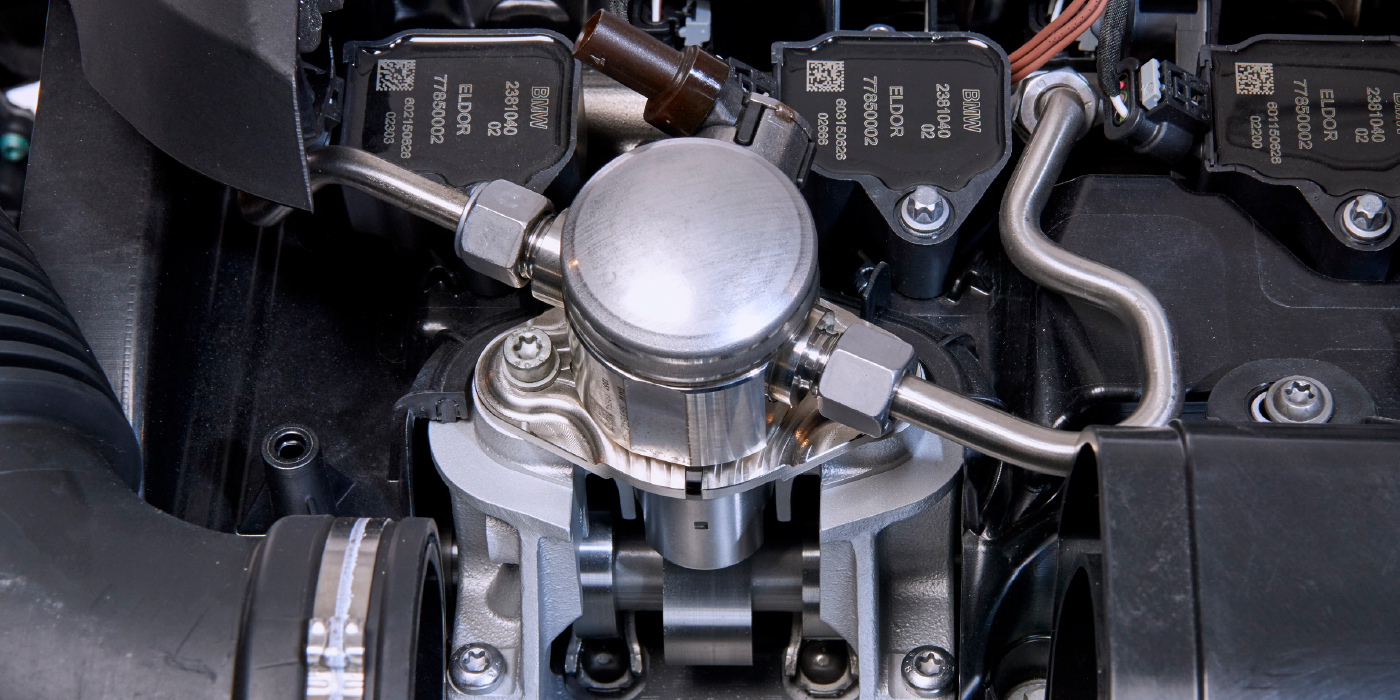
As you may have guessed, the opening photo at top shows what was found when the engine was disassembled.
In conclusion, we can say the low-pressure transducer is not the most necessary tool for a technician. Perhaps the in-cylinder pressure transducer is more needed. In addition, the low-pressure or pulsation transducer requires an understanding of the process you are trying to investigate. Nevertheless, with its help, it is possible to solve many diagnostic problems and greatly facilitate your work.