By Vasyl Postolovskyi and Olle Gladso, Contributing Writers and Instructors at Riverland Technical and Community College in Albert Lea, MN
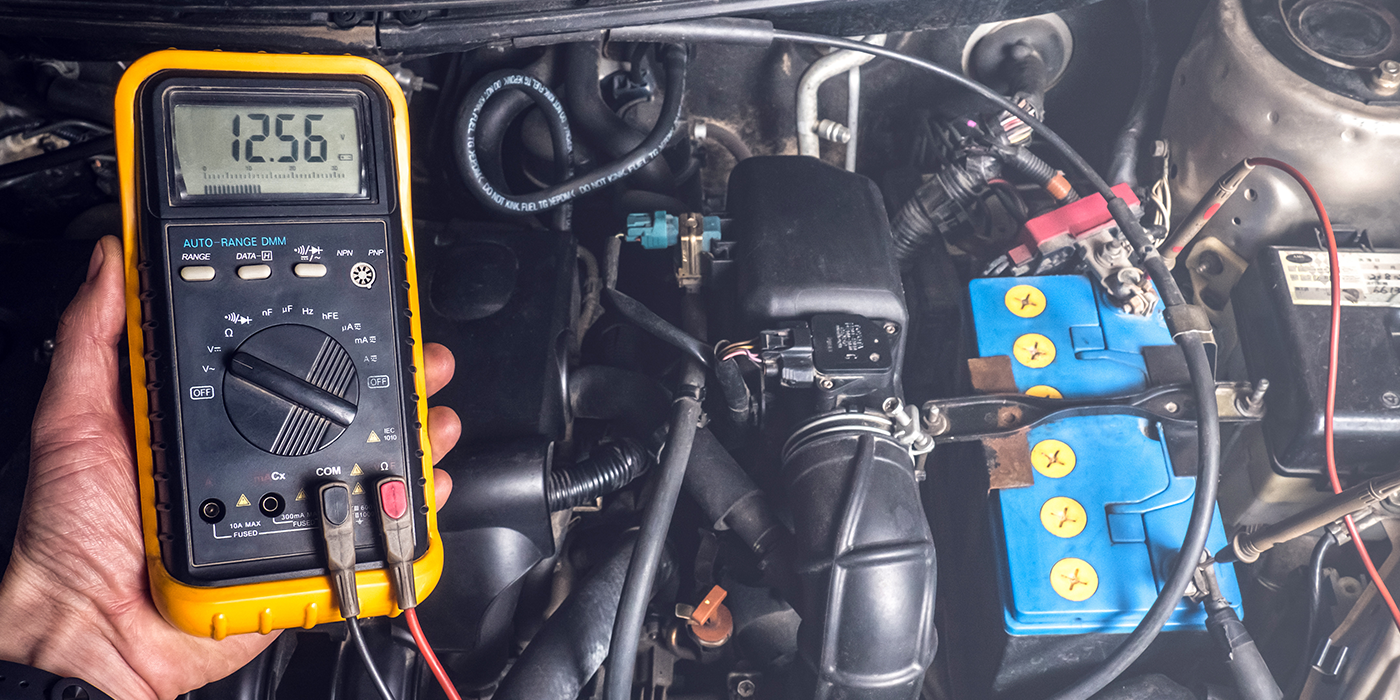
In a previous article, we examined the use of unconventional but simple methods for detecting electrical faults in vehicles. We discussed digital multimeters, current clamp meters and a digital oscilloscope. In this article, we will similarly discuss an alternative approach to diagnosing an engine using the pressure waveforms from an in-cylinder pressure transducer.
We are going to diagnose engines based on the pressure waveform obtained from the cylinder(s) of a running engine. We will need to safely disable the ignition for the chosen cylinder. One method is to connect the coil or plug wire to a spark tester. To avoid any problems from ignited fuel, from perhaps a hot surface in the cylinder, we should disable fuel delivery to the cylinder being tested as well. To display the waveform, we use a transducer that converts pressure into voltage. The voltage output can then be displayed as a trace on an oscillosocpe screen.
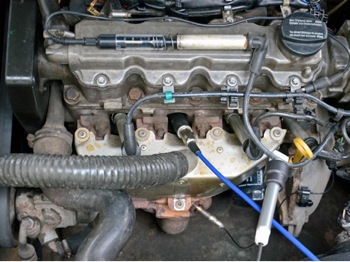
extension, a deep well adapter should be used.
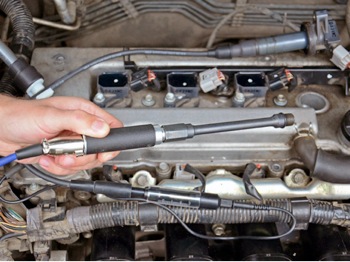
The transducer is replacing the spark plug in the cylinder being tested. (See Photo 1) Due to heating of the transducer from the running engine, the test should not run more than approximately three minutes. If the spark plug is recessed, it may be necessary to use an extension, as shown in Photo 2, called a deep well adapter. A flexible extension, such as from a compression gauge set, should not be used. This is because the flexing may cause a loss of detail in the waveform.
Although the transducer shown here is incorporated in the oscilloscope kit used, other transducers can be used as well. The pressure transducers used should have low inertia, so they react quickly to pressure changes. They should also be accurate, retain accuracy as they warm up, and accept as well as recover quickly from pressure overload situations.
Reading and Diagnosing the Pressure Waveform
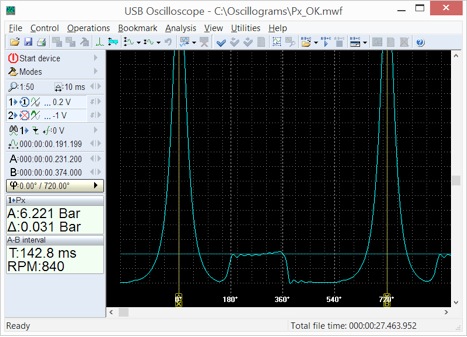
After setting up the transducer and the oscilloscope, a waveform (Figures 1 and 2 or similar) will be obtained once the engine is started. It’s best to save and/or record the waveform, then analyze it. This way, there are no time limitations present with regards to running the engine.
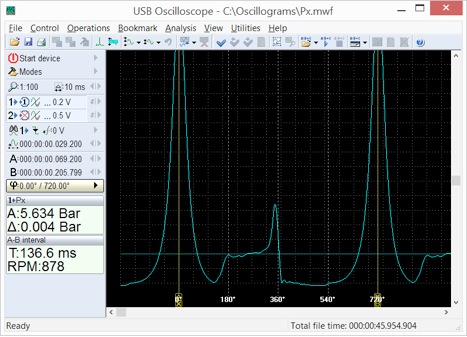
It may take some time to become comfortable with using these waveforms to analyze engines. The particular software shown here has provisions for performing automatic analysis, which can be very helpful, especially when you’re starting out performing this type of diagnosis.
and displayed by the oscilloscope program.
Automatic Analysis of Anomalies in the Pressure Waveform
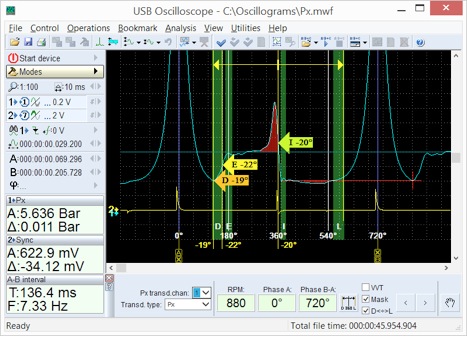
In Figure 3, the software has automatically detected deviations from the positions of characteristic points in the graph as well as shape distortions. Due to this automatic capability, the probability of detecting a mechanical defect in the engine increases, and the time spent on waveform research is significantly reduced.
Advanced Automatic Analysis Transcribing the Waveform
This particular software automatically analyzes the cylinder pressure waveform and generates a print out or report with a number of additional parameters and characteristics of the engine and the associated control unit. The calculated values are pneumatic and geometric characteristics of the cylinder; the list of found deviations is displayed in the form of text messages. To improve speed and accuracy of valve timing research, the cylinder pressure waveform is converted into a diagram of the gas amount in the cylinder and is displayed in two different ways, using a script.
A detailed diagram of the cyclic filling of the cylinder during the intake stroke, which characterizes the properties of the entire intake manifold of the engine is also provided. A diagram showing the energy consumption for scavenging exhaust gases from the cylinder is provided as well. Using these diagrams and the igntion timing signal, the ignition timing diagram is built and can be displayed.
Naturally, the script cannot replace an expert diagnostician, it can only convert cylinder pressure waveforms into a more readable form, but it does allow for a decrease in the time a diagnostician spends on analysis, and also to limit missed implicit/hidden deviations/faults. For more detailed information on the possibilities of the script, we will review each of its report tabs.
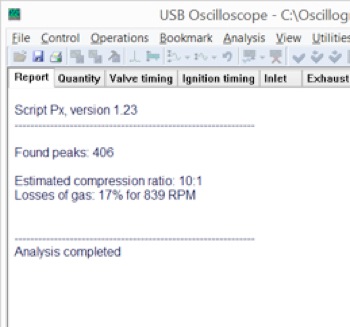
The Report Tab
The conventional or classic tool for assessing the state of an engine cylinder and piston is a compression gauge. It is designed to measure the compression or peak pressure in the cylinder obtained while cranking the engine. The measurement is a complex value and depends on losses through cylinder leakage, the compression ratio, the valve timing, the cranking speed, and the state of the intake and exhaust ports or manifold.
A reduction of compression pressure in a cylinder is usually thought of as being caused by cylinder leakage or valve timing. However, the reason can also be reduced geometric compression ratio from, for example, a bent piston rod, due to hydrolock. Hydrolock occurs when a piston tries to compress something non-compressible, such as a liquid.
The Px script, as shown in Figure 4, can distinguish cylinder leakage from low compression ratio because it independently calculates gas losses and the compression value.
The compression ratio can usually be found in the service information, under general engine data, and depends on the engine’s design.
Normal pressure or gas loss for an engine in good condition is in the 10-18% range. A loss of more than 20% could indicate excessive leakage in a cylinder. The algorithm for calculating cylinder losses is complex, with some variables that are difficult to account for. A typical problem is the heat loss of the gas in the cylinder. The heat loss arises from the fact that the gas temperature in the cylinder during compression, even without ignition, is rising above the temperature of the cylinder walls. Consequently, part of the heat energy of the gas in the cylinder is transferred to the piston, cylinder and cylinder head. The loss of heat causes a loss of pressure. In practice, the calculated cylinder pressure loss of an engine in good condition is about 10%.
The graph indicates the amount of gas in the cylinder relative to the position of the
piston in the cylinder and the stroke. Marker A is set to coincide with the end of the
intake valve closing and the opening of the exhaust valve beginning.
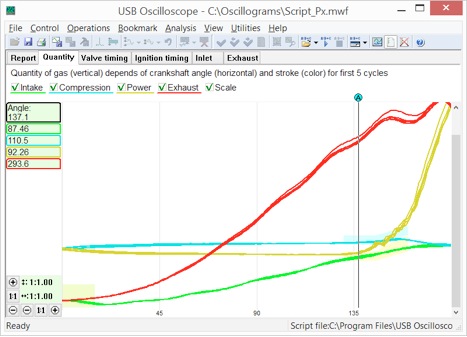
The Quantity Tab
Figure 5 shows a diagram of gas in the cylinder depending on the piston position and the stroke.
Figure 6 is zoomed in on a portion of the graph from Figure 5 and shows the typical shape of the graph from an engine in good condition.
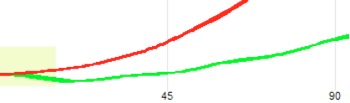
and green traces from an engine in good condition.
For the following few paragraphs, please refer to Figure 5. When plotting a diagram of the amount of gas in the cylinder, four colors are used that reflect the working strokes. The piston is at TDC on the left side of the diagram and at BDC on the right side. The volume of gas in the cylinder is represented by how high the trace rises in the vertical direction.
As the piston moves farther away from TDC on the intake stroke, given as the green trace on the diagram, read from left to right, the volume in the cylinder is increased, the pressure is lowered, and so ambient air flows from the intake manifold and into the cylinder. This causes the green trace to rise.
At BDC, the piston changes direction and the volume in the cylinder begins to decrease, but the amount of gas in the cylinder continues to increase as evidenced by the blue trace on the diagram in Figure 5. The increase in gas volume occurs because the gas has weight and thus has inertia, causing the flow to continue even after the piston has changed direction on BDC. After the gas flow has stopped, gas may start to flow back into the intake manifold due to the piston action. This backflow depends on the timing of the intake valve. When the intake valve is closed, no flow will exist, and the blue trace becomes essentially flat. In this particular case, the filling of the cylinder is maximized at 155° before TDC, and the intake valve closed approximately 140° before TDC.
After the piston passes TDC, previously compressed gas in the cylinder begins to “decompress,” but since the valves are closed, the amount in the cylinder is still almost unchanged, so the graph looks almost like a straight line (yellow trace of the diagram, the left side, read from left to right). However, the clearly visible gradual spread between the straight yellow diagram trace and the blue trace indicates the quantitative heat loss of the gas in the cylinder. The greatest amount of loss is observed near TDC when the gas pressure and temperature are at their maximum.
The exhaust valve begins to open before the piston reaches BDC. In this particular case, the opening starts at 140° after TDC. The pressure measurements are made without a source of ignition, so there’s no combustion. The cylinder pressure at this point is almost identical to the pressure in the intake manifold, which is well below atmospheric pressure. The pressure in the exhaust manifold is close to the atmospheric pressure and exceeds the pressure in the cylinder. Therefore, once the exhaust valve starts to open, the exhaust gases from the exhaust manifold begin to flow into the cylinder. This flow equalizes the pressure in the cylinder with the atmospheric pressure. This equalization is reflected in the diagram as a sharp rise of the yellow trace.
After passing the BDC point, the piston starts to push gas from the cylinder into the exhaust manifold (red trace on the diagram, read from right to left). When approaching TDC, the exhaust valve begins to close and the intake starts to open. At this point, the pressure in the cylinder is still close to atmospheric, as the cylinder is still open to the exhaust manifold. After passing through the TDC point, when the exhaust valve is fully closed and the intake is opening, part of the remaining gas in the cylinder flows into the intake manifold, since there is low pressure or vacuum in the intake manifold. Thus, the amount of gas in the cylinder is not minimum at TDC, but later. In this case, the minimum amount is reached approximately 20° after TDC, as shown on the diagram as a drop in the green trace. Further, because the volume in the cylinder is increasing, the gas flows from the intake manifold again.
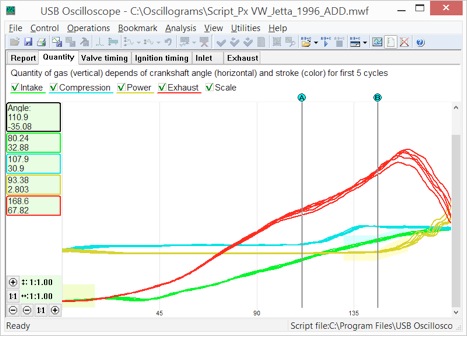
Thus, using the graph of the gas quantity in the cylinder we can detect and measure where the intake valve closes and where the exhaust valve opens. If the nominal values for valve opening and closing are not given, deviations will have to be detected based on cylinder-to-cylinder variation (or comparing to a known-good engine).
Different manifold designs will show different relative timing with respect to intake and exhaust phases. However, the width of the intake phase is always substantially the same as the exhaust phase. The phases are always substantially symmetrical relative to TDC as well. In practice this means that when the intake valve closes at 140° before TDC, the exhaust valve must be opened approximately the same 140° after TDC. In other words, in the same relative position of the piston. Because of this symmetry, the diagram of the amount of gas in the cylinder shows the same characteristic points located above one another.
set in the position of the piston coinciding with the end of closing of the intake valve and
marker B with the start of the exhaust valve opening.
This is true for engines with narrow valve timing and with wide valve timing — phase asymmetry usually does not go beyond ±10°. This rule does not necessarily apply to engines equipped with variable valve timing, however.
Figure 7 shows the result if the timing belt or chain is installed one tooth late on an engine with a single overhead camshaft. This error generally causes about a 15° delay. InFigure 7, the amount of gas in the cylinder is reflected as an offset of the closing of the intake valve at about 15° to the left, and the opening of the intake is about 15° to the right. In this case, it turns out that the characteristic points are away from each other by approximately 30°.