By Andrew Shulgin, Vasyl Postolovsky and Olle Gladso
Have you ever wondered why engine control systems from different manufacturers have common principles and similar designs, but are diagnosed using differing devices? Could one single tool diagnose engine faults in vehicles coming from different manufacturers? This article will investigate the possibilities.
Most vehicle manufacturers offer many different models of their product, which are usually equipped with engines of their own design. In general, each manufacturer uses its own unique software to control these engines, and as a consequence, has its own diagnostic equipment (scanners) and software. In order to be able to successfully diagnose and repair these different designs, a shop needs access to many different pieces of diagnostic equipment. In practice, the shop can generally only repair those brands and models of vehicles for which the appropriate diagnostic scanner is available.
There are a number of generic OBD scanners available. Their main advantage is that they display standardized powertrain data for most manufacturers. This greatly facilitates the diagnosing of a wide range of cars and makes it possible to determine most failures, especially if they are emissions control related. However, many of these scanners are providing no or only partial diagnostic information on other non-emissions-related vehicle systems.
Universal scanners offer much greater functionality than generic scanners for the diagnosis of emissions as well as non-emissions-related vehicle systems using the manufacturer’s data protocol and diagnostic information.
Most scanners read error codes about the same. However, reading DTCs is not diagnostics; it is only reading the control unit’s interpretation of data along with a short description of the code meaning. A technician has to decide if the “diagnosis” offered by the control unit is correct, and whether additional testing and measurements are needed. The preferred method of diagnosis for cost and time reasons is to determine the cause of the failure with little or no disassembly of the diagnosed system.
Since there is always a chance of incorrect diagnosis, best practice is to use an alternative method to confirm the failure without relying on the control unit’s interpretation. Some alternative methods are to read and interpret sensor values as reported by the scan tool, using bidirectional control to activate control unit outputs such as relays, solenoids and motors, or by using specialized monitoring software. The problem here is that we are again relying on the control unit’s interpretation of sensor data, even if in a raw format. In some cases, it would be preferable to utilize techniques that do not rely on the control unit’s and/or the scanner’s interpretation of the data.
Almost all vehicle engines operate on similar principles and are arranged about the same. Mechanically, we have the crankshaft, connecting rods, pistons, valves and so on. Electrically, we have roughly the same set of sensors and actuators, fuel supply system and ignition systems. Since this is the case, certain diagnostic principles and techniques are applicable to most engines, regardless of the brand and model of the vehicle.
In prior articles, such as in the March 2012 issue of Underhood Service and in TechShop’s April, August and October 2014; February 2015; and October 2015 issues, we have considered them. The articles analyzed usage of the CSS, Px and ElPower scripts, written by Andrew Shulgin. These scripts have now been used for four years in many automotive repair shops worldwide and with their help, more than 1 million vehicles have been diagnosed. In the vast majority of the cases, the diagnosis was correct. Automotive shops that started practicing these techniques found that the average time to diagnose problems decreased significantly, down to an average of five to 10 minutes.
In this article, we’ll to show and analyze some examples of the CSS script usage. But first, let us briefly recall what it is, what it is for and how it works.
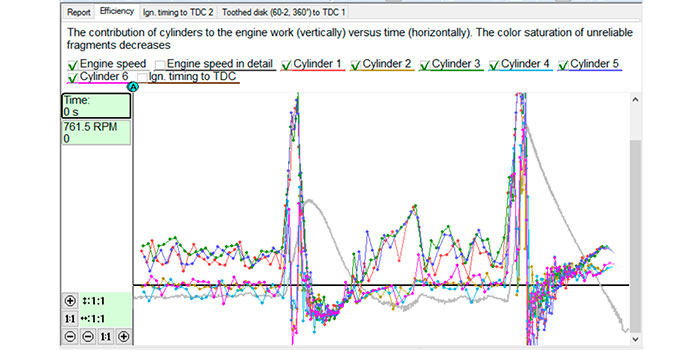
The CSS script allows us to identify which cylinders are misfiring or have decreased power contribution as well as the reason for the problem. The script does not rely on the capabilities of the scanner or the onboard diagnostic system and is able to provide more information to analyze the cause of the problem. The script works by analyzing the power contribution from each cylinder during engine operation in different modes. The data is displayed in the software under a tab labeled “Efficiency,” where the gray trace shows changes of engine speed during the measurement period. Different color graphs show the contribution from each of the cylinders.
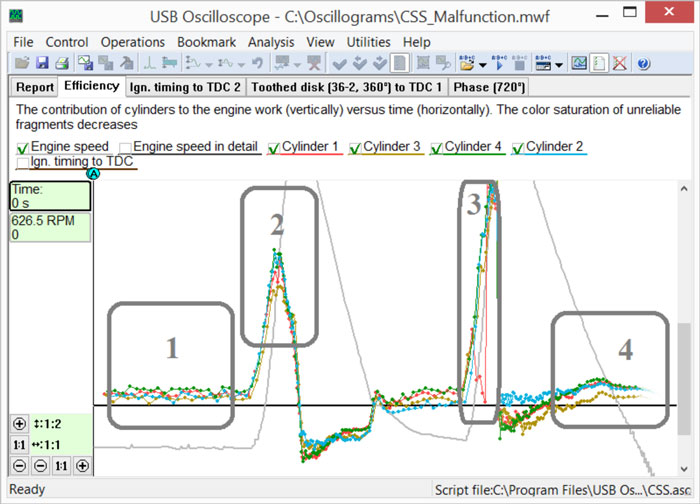
Figure 1 shows an example of how the data is displayed on the Efficiency tab.
The different colors used in the graph allow us to evaluate each of the cylinders. The representation shows four different operating modes:
- Idle. This part allows us to estimate the quality and stability of the engine at idle.
- Relatively slow throttle opening and closing. This part shows the quality of the air/fuel mixture. Plugged fuel injectors and/or vacuum leaks would show here.
- Snap throttle opening. This mode helps diagnose the quality of the ignition system.
- With the ignition shut off and the throttle held at WOT (wide open throttle), the engine is decelerating with no combustion. This mode displays dynamic compression. Here, cylinder pressure problems caused by worn piston rings, valve timing problems or other issues can be diagnosed. Note that the script is able to analyze engines equipped with ETC (electronic throttle control) even if the default throttle opening is low.
To obtain enough data to run the CSS script, only two connections need to be made:
- CKP (crankshaft position) sensor, for obtaining angular velocity (rotational speed), and
- Ignition event in one of the cylinders, for synchronizing.
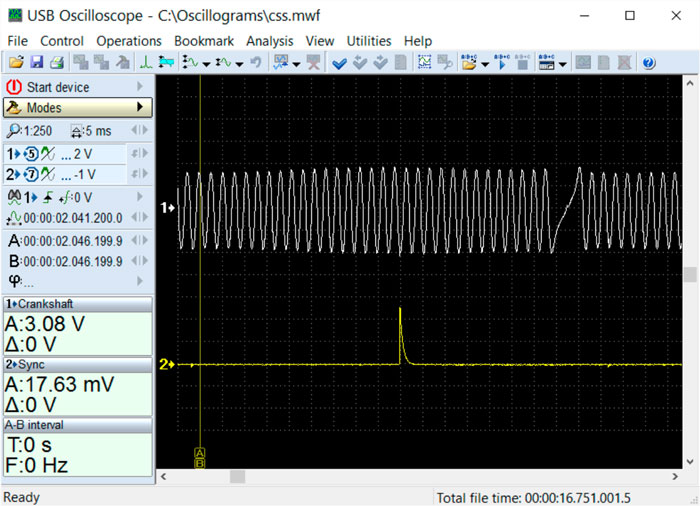
Figure 2 shows these two pieces of data on the oscilloscope screen.
The angular velocity signal is easiest to record from the engine’s CKP sensor.
The synchronization or timing signal is easiest to obtain from an ignition coil or plug wire using a synch probe with no direct electrical connection. If a diesel engine, the signal can easily be obtained from one of the fuel injectors either through a mechanical or an electrical connection. Different methods may be required to obtain these signals, depending on the design of the engine and its control unit. It should be noted that these signals can be obtained from almost any engine, regardless of the brand, model and year.
Now let’s move on to some concrete examples.
The first example is a 2013 Chevrolet Aveo 1.5L.
The owner of this car with a 4-cylinder gasoline engine was concerned about a loss of engine power and poor idle quality.
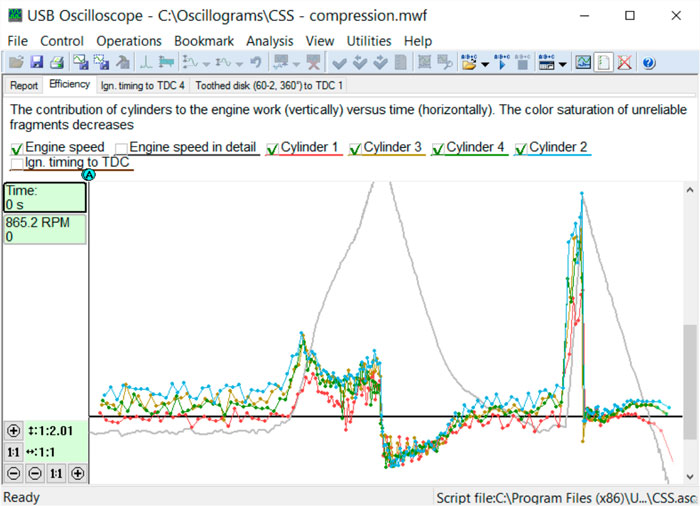
Figure 3 shows the Efficiency data obtained from this vehicle.
It can clearly be seen that the red graph showing the operation of cylinder 1 displays lowered efficiency compared to the graph of the other cylinders during the analyzed engine operating modes, namely:
- Idle;
- Smooth throttle opening;
- Snap throttle opening; and
- Deceleration of the engine with no combustion and WOT.
During analysis of the Efficiency graphs it is usually best to start with the last operation mode of the engine, as it allows you to compare the dynamic compression in the cylinders. At the last stage, the ignition system and the fuel supply are off while the engine is still coasting with the throttle valve kept fully open. Under this condition, the cylinders contain only air that is subsequently compressed as the piston moves up in the cylinder due to the inertia in the engine from the flywheel and crankshaft. Once the piston passes TDC (top dead center), the compressed air in the cylinder pushes the piston back down. The piston being pushed down causes some acceleration of the crankshaft. More cylinder pressure equates to more acceleration. This crankshaft acceleration is reflected here as the efficiency graphs and thus they show the relative compression of the engine cylinders.
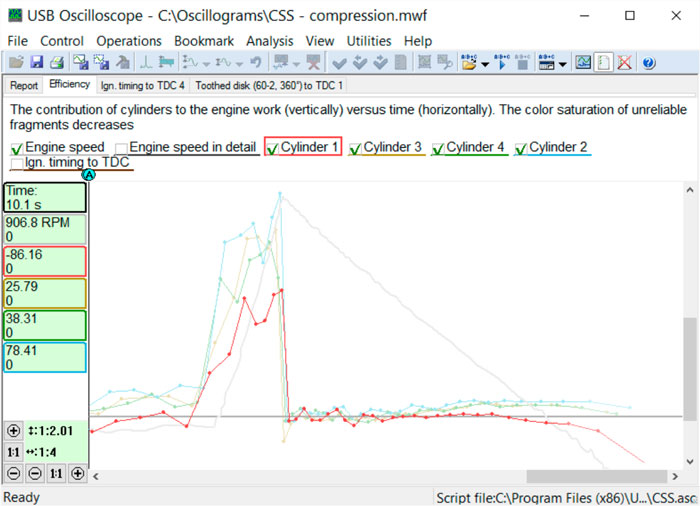
Figure 4 is the Efficiency graph for cylinder #1 zoomed in on the last phase of the test.
The graph clearly shows that this cylinder, when compared to the other cylinders, provides less crankshaft acceleration. In other words, the cylinder has less output. This lack of output demonstrates compression loss in this particular cylinder. Because the engine speed is decreasing, the amount of time it takes for the compression and power stroke to complete is increasing. This gives the air in the cylinder more time to escape through whatever is causing the compression loss. Since a loss of compression usually causes loss of power and deteriorated idle quality, it was decided to postpone further checking until the engine’s mechanical condition had been resolved.
Once the mechanical failure was repaired, the engine operated as designed and further checks were not required.
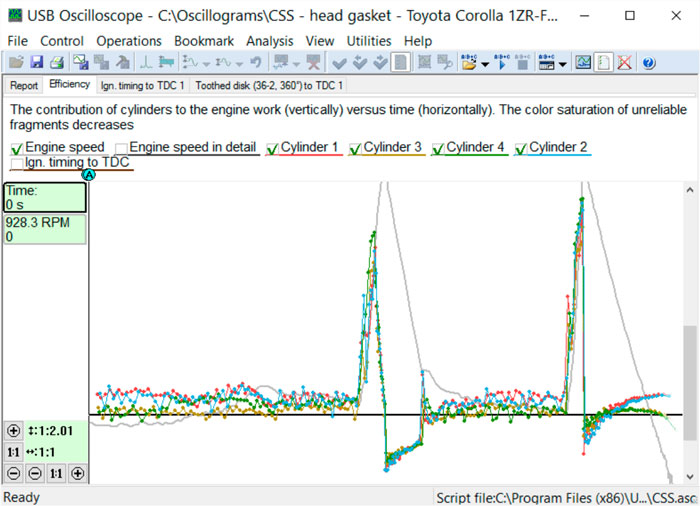
Figure 5 shows the Efficiency graph from a 2007 Toyota Corolla equipped with the 1.6L 1ZR-FE engine.
The yellow and green traces, which correspond to cylinders 3 and 4, have an obvious downward trend in the last phase of the measurement. As previously stated, the last part of the test is performed with ignition and fuel removed (ignition shut off) and throttle held open. The indicated loss of efficiency during this phase is caused by a compression loss.
It is noteworthy that the engine control unit was trying to compensate for the failure by advancing the ignition timing for the weakest cylinder. Due to this compensation, the idle quality was somewhat stable. This is clearly seen on the color traces before the first snap throttle.
During the subsequent repair, it was revealed that the fault occurred due to a blown cylinder head gasket between cylinders 3 and 4, causing low compression in these two cylinders.
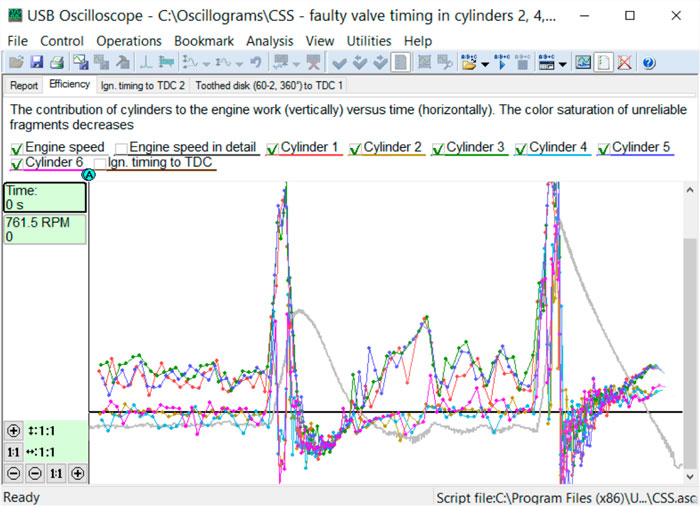
The Efficiency graphs in Figure 6 are from a vehicle that is equipped with a V6 engine.
The graphs shows that under all conditions cylinders 1, 3 and 5 are performing better than cylinders 2, 4 and 6. The last part of the graphs also shows that the dynamic compression in cylinders 1, 3 and 5 is better than in cylinders 2, 4 and 6. This engine has two separate camshafts, one for each cylinder bank. The displayed results are suggestive of a timing problem on the lower performing cylinder bank. The question is: Is it ignition timing or valve/cam timing that is causing the problem? Ignition timing would not affect dynamic compression, so the most likely problem is cam timing.
Checking of timing marks on the crankshaft and camshaft pulleys confirmed the diagnosis.
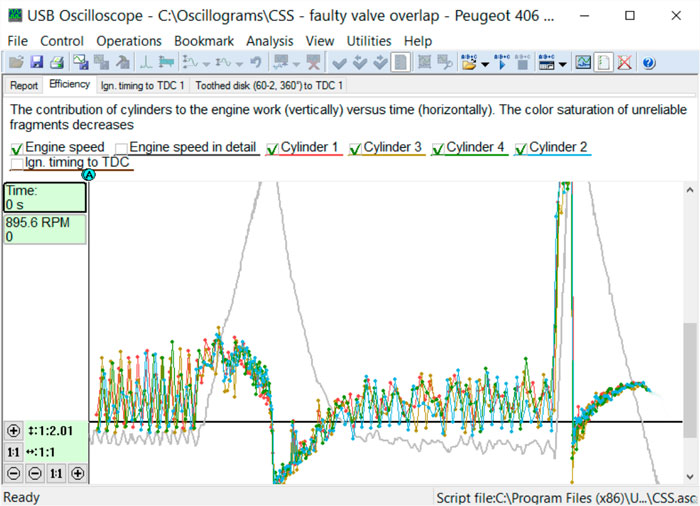
Figure 7 shows Efficiency graphs from a 16-valve engine that has an unstable or rough idle.
The graphs show that all four cylinders of this engine during idle were intermittently misfiring. During off-idle conditions, the engine was operating smoothly and all four cylinders had equal power contribution and dynamic compression. One common reason for intermittent misfires such as these, which affect all the cylinders, is contamination or dilution of the air/fuel charge in the cylinders. This can be caused by incorrect valve timing causing excessive valve overlap. Since this is a 16-valve engine with two camshafts, one intake and one exhaust, incorrect camshaft timing could be the cause. If the engine is equipped with variable valve timing, problems in that system could have the same effect. The misfire occurs and is intermittent for the following reason: during the valve overlap phase when the engine is at idle, exhaust gases from the exhaust manifold are drawn into the cylinder on the piston downstroke and may also even flow through the open intake valve into the intake manifold. The mixture in the cylinder will be highly contaminated with exhaust, similar to excessive EGR (exhaust gas recirculation) and the ignition spark is unable to reliably ignite the charge. On the next piston downstroke, exhaust from the exhaust manifold is again drawn back into the cylinder. However, this time the exhaust contains air and fuel and less spent gases since no combustion occurred the previous cycle. The ignition spark is able to ignite the charge or mixture and we have normal combustion. Then the cycle repeats. Exhaust is drawn into the cylinder, misfire occurs …
In this case, the problem was caused by improper installation of the timing belt. Realigning the valve timing solved the problem.
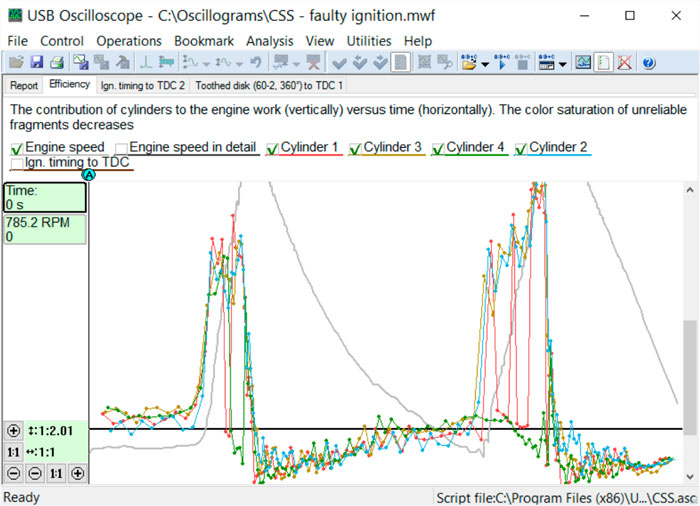
Figure 8 shows Efficiency graphs from an engine that idles smooth, but has a distinct loss of power during acceleration.
The graphs show that all the cylinders perform equally well during idle conditions, but during smooth and snap throttle, cylinders 1 and 4 (red and green traces) suddenly stopped contributing power while cylinders 2 and 3 (blue and yellow traces) were unaffected. This particular behavior is typical of an ignition system problem. In general, an ignition system will provide sufficient spark to initiate combustion, or not at all. At idle, there is very little cylinder pressure because the throttle valve is mostly closed and there is very little load on the engine. The voltage requirement to ionize the spark gap in the spark plug is very low and a marginal ignition coil can deliver sufficient voltage to create the spark. However, when the throttle is opened, cylinder pressure increases and along with that the voltage requirement of the ignition system. Now a marginal ignition coil may be unable to deliver sufficient voltage and the ignition spark does not occur. This particular engine is equipped with an ignition system where one ignition coil serves cylinders 1 and 4 and one coil serves cylinders 2 and 3.
Once the ignition coil that served cylinders 1 and 4 was replaced, normal engine operation resumed.
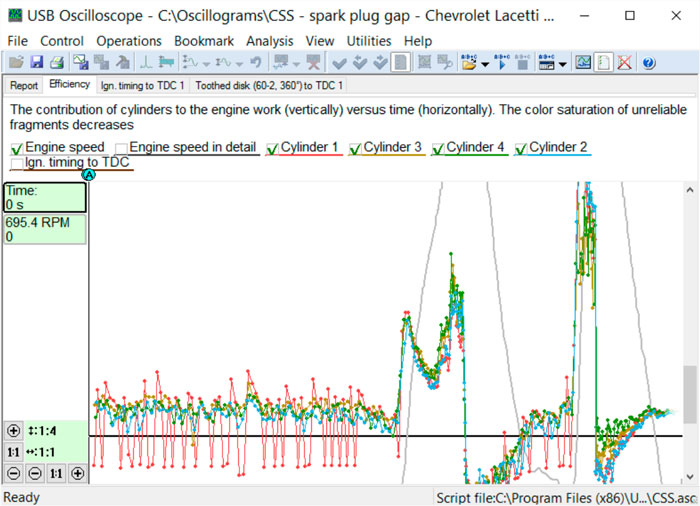
Figure 9 shows Efficiency graphs from a vehicle with a steady misfire at idle.
The traces show that cylinder 1 (the red trace) has the misfire, but it also shows that the misfire is only partial. In other words, combustion is occurring, but is not complete. This particular graph distortion is characteristic of a too small spark plug gap. Because the gap is so small, the voltage requirement for spark gap ionization is very low. At idle, the requirement is so low there is insufficient spark energy for complete combustion ionization to occur.
The misfires disappeared once the spark plugs were replaced.
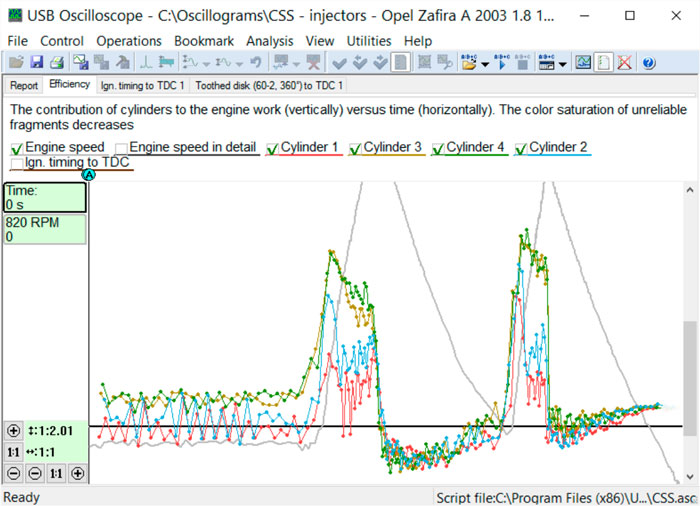
Figure 10 shows Efficiency graphs from a vehicle with loss of power and misfires.
The last phase of the graph shows all the cylinders practically superimposed on top of each other. This means that the dynamic compression of all the cylinders is approximately equal. During smooth or slow and snap throttle, cylinders 1 and 2 display less efficiency, and at idle, they were misfiring. This is a typical example of imbalanced fuel injectors. The injectors in cylinder 1 and 2 are injecting less fuel, most likely due to being partially plugged. At idle, the injected amount is very small and the decreased fuel delivery in these two cylinders caused the air/fuel ratio to be too lean for steady combustion. Off-idle, the reduced fuel delivery does not cause a direct misfire in this case, but does cause loss of efficiency.
By cleaning the fuel injectors off the vehicle, the problem was repaired.
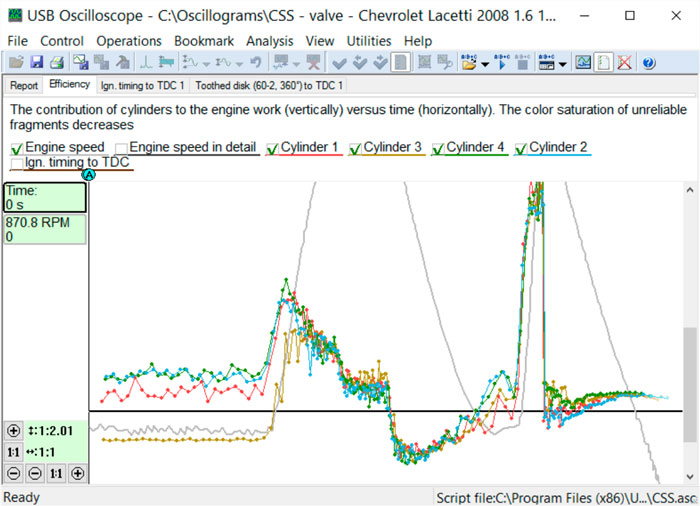
Figures 11 and 12 are the Efficiency graphs from two tests performed on a vehicle that intermittently would have misfires and loss of power.
Looking at the graph in Figure 11, it can be seen that in the beginning, cylinder 3 (yellow efficiency graph) did not have any power contribution at all. However, during the smooth throttle valve opening, the cylinder did start to work as it should. Once the cylinder “came online,” it remained working. So, we know the faulty cylinder is 3, but we do not know the cause of the fault. For that reason, the test was repeated and the result is shown in Figure 12.
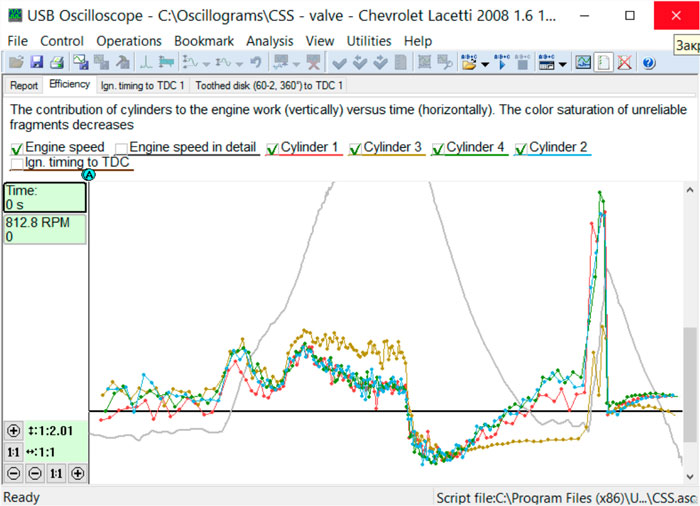
At the start of the test, all the cylinders are working as designed. However, after the smooth, or slow, throttle opening, cylinder 3 again stopped contributing power. In the last stage of the measurement, we see that the dynamic compression in the problem cylinder has significantly deteriorated. So, we have an intermittent loss of compression in cylinder 3. This is a strong indication of a valve problem, most likely a valve that sticks open.
Subsequent disassembling of the engine showed that the cause of failure was that the intake valve of cylinder 3, which was too tight in the guide, would intermittently stick once opened.
More details and updates can be found at www.autoscope.eu.